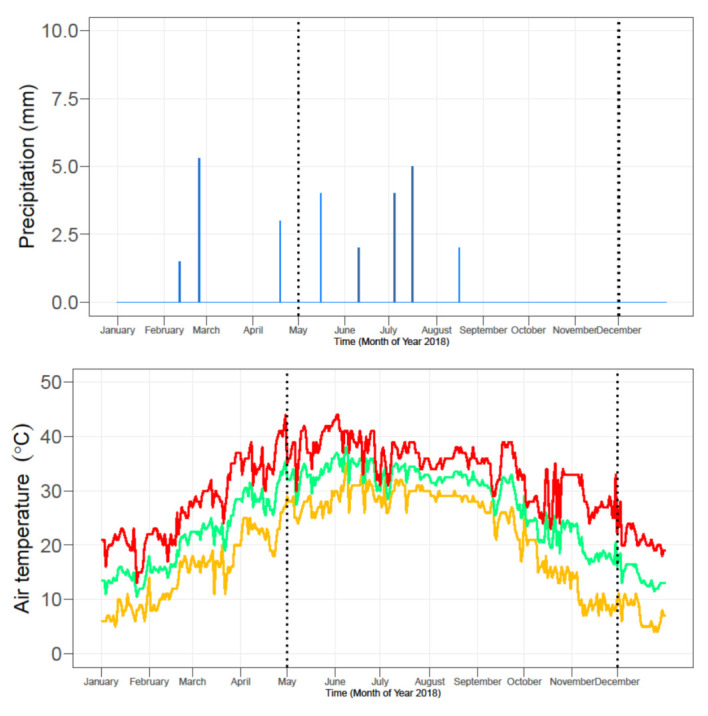
Figure 1.

Daily total precipitation and average daily minimum (Tmin), mean (Tavg), and maximum (Tmax) air temperature. Daily precipitation in Multan, Pakistan, from January to December 2018. The dotted lines show the duration of the experiment from the sowing to the harvesting of the cotton crop.
