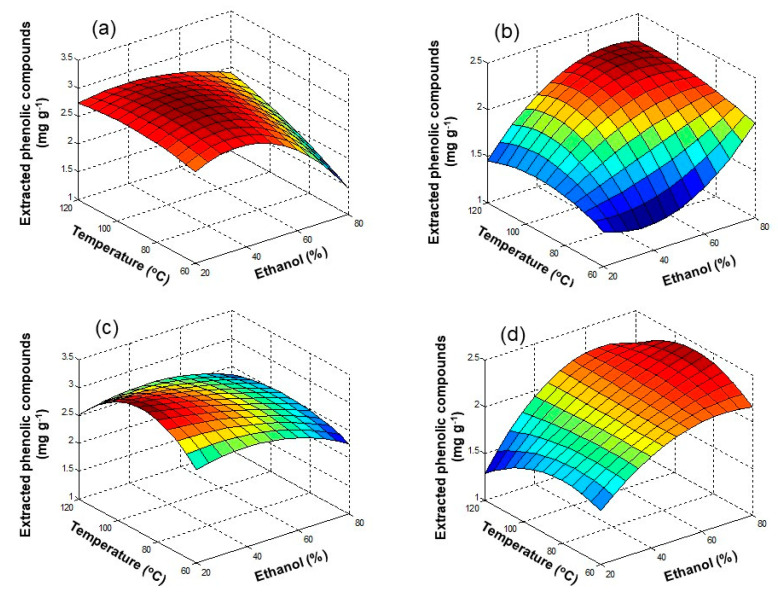
Figure 4.
Response surface plots for extracted phenolic compounds (mg GAE g−1) in olive pomace and lees filters by MAE as a function of ethanol concentration (%), temperature (°C), and extraction time (min): (a) olive pomace, 5 min; (b) lees filters, 5 min; (c) olive pomace, 15 min; (d) lees filters, 15 min.

