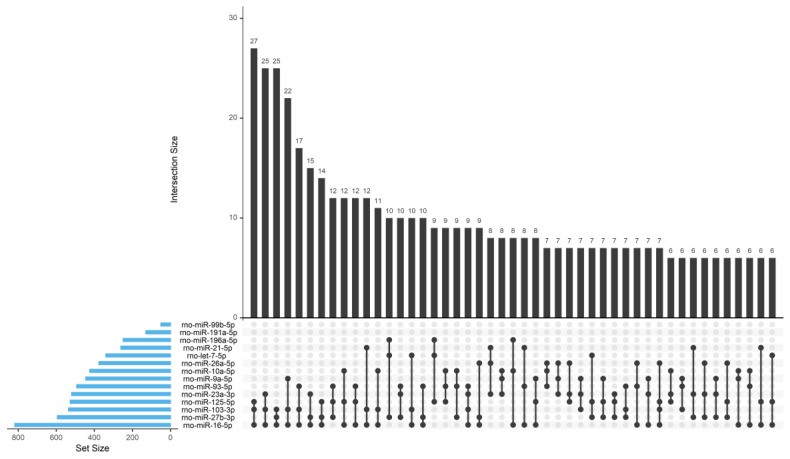
Figure 6.
Characterization of WT SC-derived EV cargo in terms of miRNA content. Upset plot that shows the instances where more than 2 miRNAs target more than 5 genes. The plot is made using the R package “UpSetR”. The blue bars on the left side of the plot show the number of targets predicted for each miRNA. The right-side bar plot show the number of genes targeted by only a single miRNA (single black dot in the lower right panel) or multiple miRNAs (multiple linked dots in the lower right panel).

