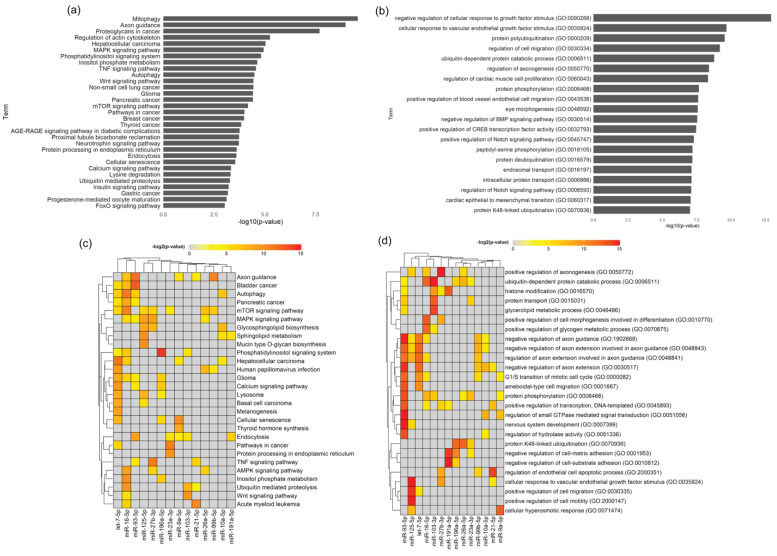
Figure 7.
WT Schwann cell EV Pathway and Process analysis. (a) Pathway analysis for all genes predicted to be targets of 3 or more miRNAs. Hits from KEGG pathways with p-value < 0.05. Cancer hits were removed. (b) Pathway analysis for all genes predicted to be targets of 3 or more miRNAs. The top 20 hits from Gene Ontology Biological Process. (c) Pathway analysis for predicted targets of each individual miRNA. The 30 most significant hits from KEGG pathways are shown. The heatmap shows the level of significance—red being the most significant, grey meaning not significant. (d) Process analysis for predicted targets of each individual miRNA. The 30 most significant hits from Gene Ontology Biological Process are shown. The heatmap shows the level of significance—red being the most significant and grey representing non significance.

