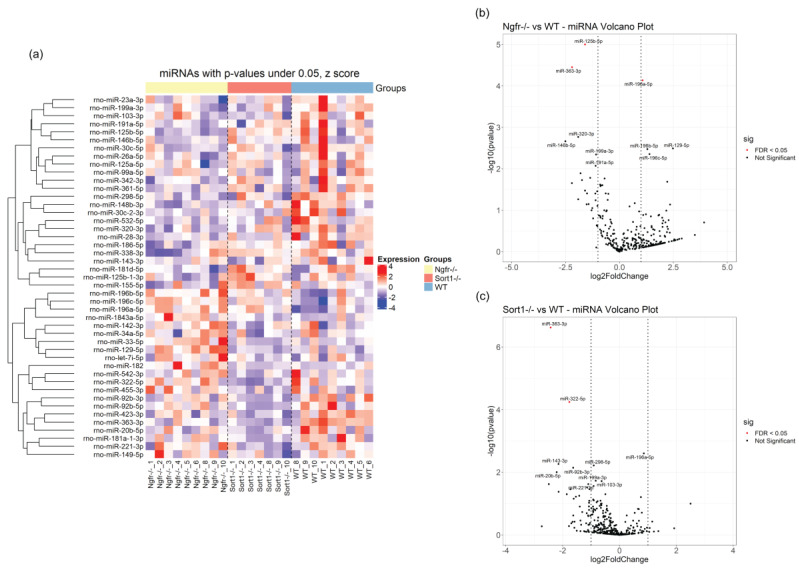
Figure 9.
Differentially expressed miRNAs in EVs derived from Ngfr−/− and Sort1−/− compared with EVs from WT Schwann cells (SCs). (a) The 45 most significantly differentially expressed miRNAs (not multiple-testing corrected) are shown as a heatmap covering all samples from WT, Ngfr−/− and Sort1−/− SCs. Top annotation shows Sort1−/− in orange, Ngfr−/− in yellow and control WT as blue. Shown are z scores of log2-transformed RPM values. (b) Volcano plot for EV miRNAs from Ngfr−/− versus WT comparison and (c) Volcano plot for EV miRNAs from Sort1−/− versus WT. Plotted are –log10(p-values) vs. −log2(fold change). Red means < 0.05 adjusted p-value. Vertical lines indicate +/− 1 log2(fold change). The names for the 10 most significant miRNA are indicated.

