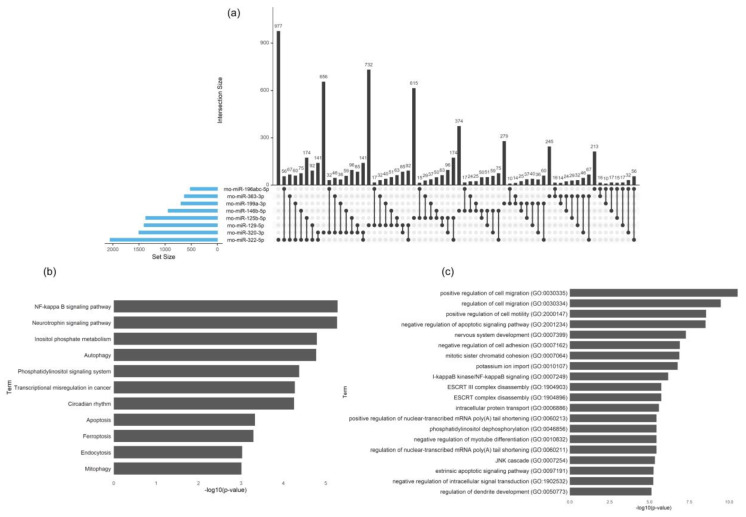
Figure 10.
Transgenic Schwann cell EV cargo characterization (lacking p75NTR or sortilin expression). (a) UpSet plot showing the number of predicted target genes found to be targeted by individual miRNAs or by multiple miRNAs. The plot is made using the R package “UpSetR”. The blue bars on the left side of the plot show the number of targets predicted for each miRNA. The right-side bar plot shows the number of genes targeted by only a single miRNA (single black dot in the lower right panel) or multiple miRNAs (multiple linked dots in the lower right panel). (b) Pathway analysis for all genes predicted to be targets of 3 or more miRNAs. All hits from KEGG pathways with p-value < 0.05. (c) Pathway analysis for all genes predicted to be targets of 3 or more miRNAs. The top 20 hits from Gene Ontology Biological Process.

