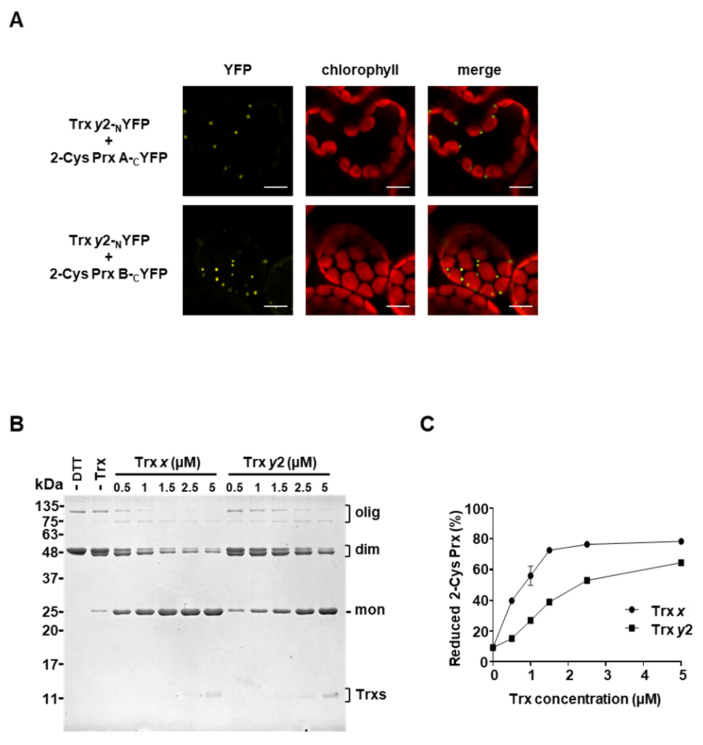
Figure 5.
Analysis of the interaction of Trx y2 with 2-Cys Prxs in planta and in vitro. (A) BiFC analysis of the interaction of Trx y2 with the two Arabidopsis 2-Cys Prxs isoforms, A and B. Confocal microscopy micrographs of mesophyll cells of Nicotiana benthamiana leaves acquired 4 days after agro-infiltration with the indicated constructs. Red, chlorophyll autofluorescence; yellow, YFP fluorescence. Bars correspond to 10 μm. (B) Redox interaction between Trx y2 and 2-Cys Prx. Recombinant 2-Cys Prx (25 μM) from rice was incubated, in the presence or absence of DTT (250 Μm), with the indicated concentrations (0–5 μM) of Trx y2 or Trx x for 30 min. Thiols were blocked with iodoacetamide, and samples were then subjected to non-reducing SDS–PAGE and stained with Coomassie blue. The reduction of 2-Cys Prx is visualized as the shift from the dimeric (dim) to the monomeric (mon) form of the enzyme, corresponding to the oxidized and reduced forms, respectively. Molecular weight markers (kDa) are indicated on the left; mon, monomer; dim, dimer; olig, oligomer. (C) Band intensities were quantified (GelAnalyzer) and the percentage of the reduction level of 2-Cys Prx was calculated as the ratio between the monomeric form and the total. Each value is the mean of three independent experiments ± standard error (SE).

