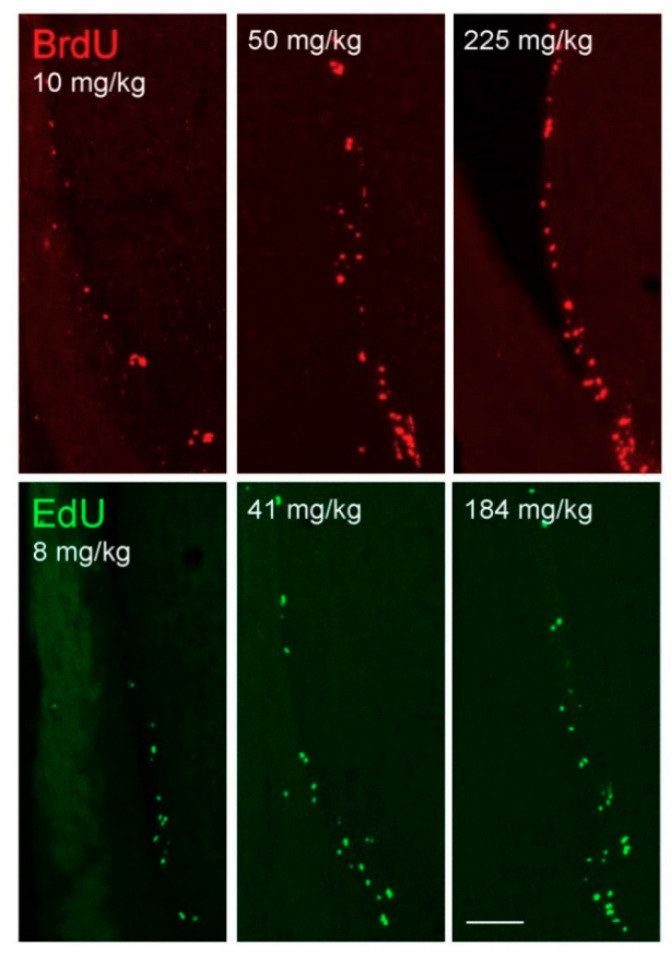
Figure 4.
Fluorescent immunohistochemical labeling of BrdU (red) and fluorescent detection of EdU (green) after injection of different doses of the proliferation markers. Images show VZTSM after 10, 50, and 225 mg/kg BrdU or equimolar doses of EdU. BrdU was detected by the antibody OBT0030. The dose 50 mg/kg of BrdU resulted in more labeled cells than the dose 10 mg/kg but did not differ from the dose 225 mg/kg. The same applies for equimolar doses of EdU. Medial is left, lateral is right. The white scale bar in the last image represents 100 μm.

