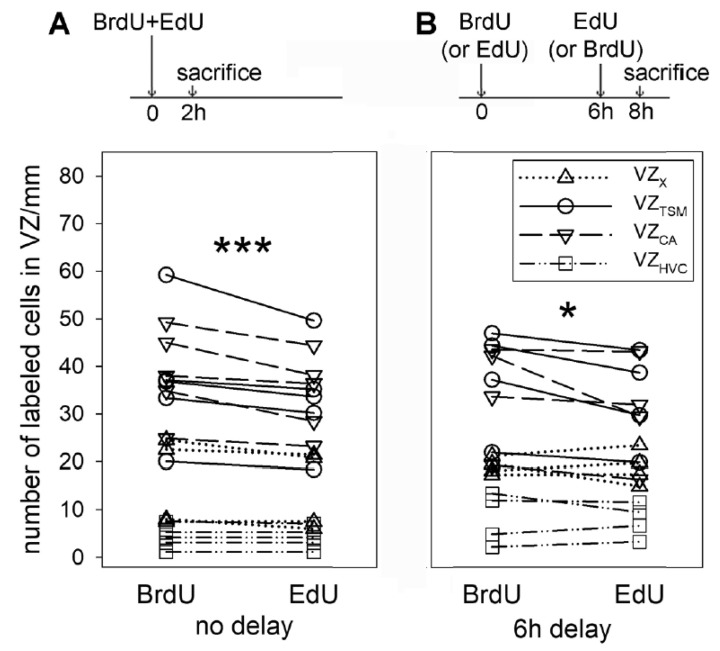
Figure 5.
Scheme of BrdU and EdU injections and quantification of labelled cells in VZ of the same birds. Five birds in (A) received BrdU and EdU at the same time. Two birds in (B) received BrdU and 6 h later EdU, 2 other birds received EdU and 6 h later BrdU. Each line in the graphs connects the values from the same animal. The same symbol/line represents values obtained in VZX, VZTSM, VZCA, or VZHVC. BrdU labeled more cells than EdU. * represents p < 0.05, *** represents p < 0.001, paired t-tests.

