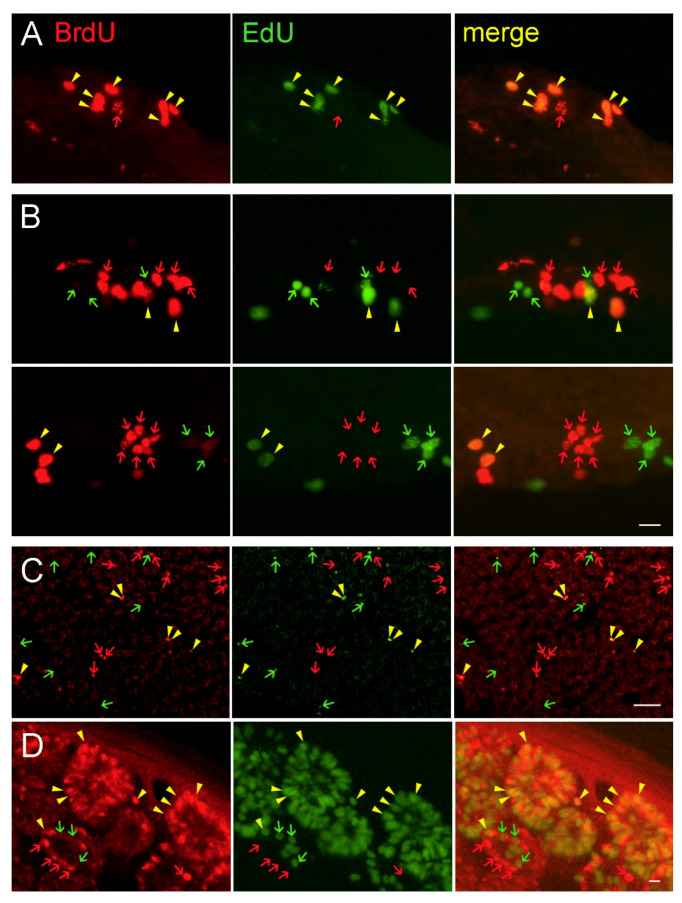
Figure 6.
Fluorescent immunohistochemical labeling of BrdU (red) and fluorescent detection of EdU (green) in the brain (A,B), liver (C), and intestine (D) after injection of the proliferation markers in the same animal. (A) BrdU+ and EdU+ cells in VZ when the markers were injected simultaneously. (B) BrdU+ and EdU+ cells in VZ when the markers were injected with 6 h delay. Upper row—BrdU injection followed by EdU, lower row—EdU injection followed by BrdU. BrdU+ and EdU+ cells in liver (C) Liver and intestine (D) when the markers were injected with 6 h delay (BrdU first). BrdU was detected by the antibody MoBU-1. Red and green arrows point to the single labelled cells, yellow arrowheads point to the double labelled cells. The images document the results shown in Figure 5. The white scale bar represents 10 μm in A and D and 50 μm in C.

