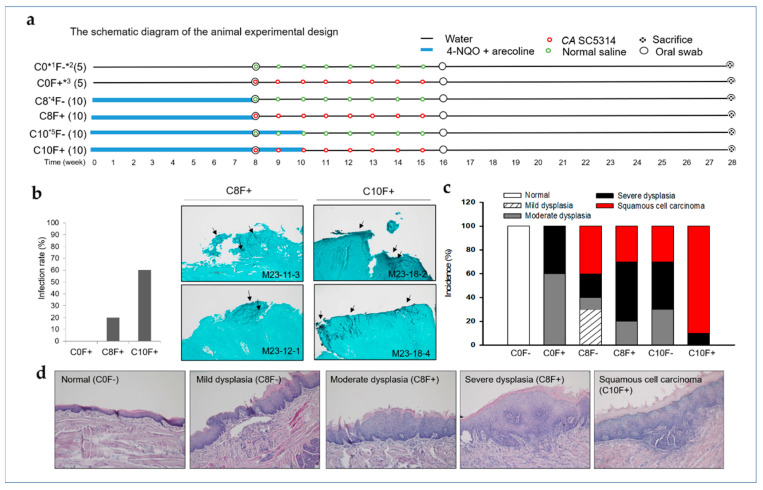
Figure 3.
Oral infection of CA promotes the development of OSCC in mouse cotreated with 4-NQO and arecoline (NA). (a) The schematic diagram of the animal experimental design. (b) Histogram of CA SC5314 oral infection rate in mice groups. Oral swabs were collected at week 8, 16, and 28 and sent for microbial culture using CHROMagar Candida plates. Oral infection of CA SC5314 was determined with the oral swabs obtained at week 28. Representative GSM staining images of the CA-positive samples from C8F+ and C10F+ groups are shown. Arrows indicate the presence of fungi (black stained) in the samples. Magnification, ×100. (c) The bar chart plots percentage of pathological categories in tongue biopsies collected from mice in each group. (d) Representative histopathological sections of tongue tissues with different stages of malignant transformation. Magnification, ×100. *1 The control mice group without fed with NA; *2 Without treatment of CA SC5314; *3 With treatment of CA SC5314; *4 Mice group fed with water containing NA for 8 weeks; *5 Mice group fed with water containing NA for 10 weeks.

