Figure 2.
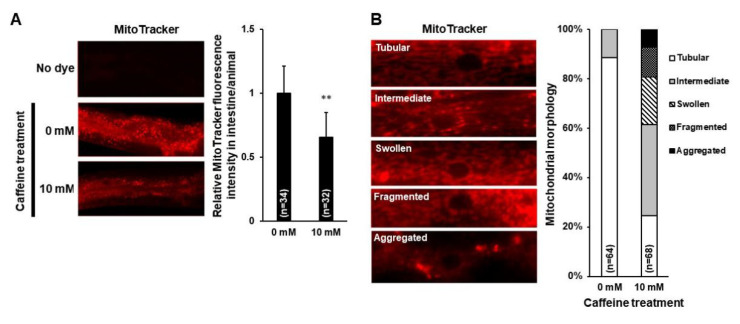
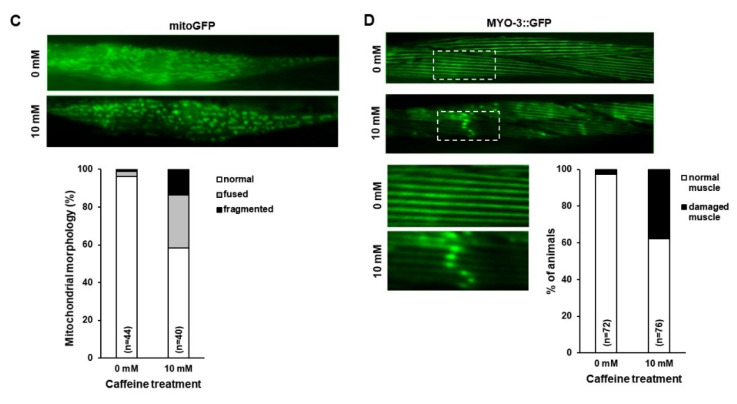
Caffeine intake reduced mitochondrial activity and disrupted mitochondrial morphology in Caenorhabditis elegans. (A) Comparison of mitochondrial activity in the intestine of caffeine-fed animals (10 mM) and that of the caffeine-free diet control group (0 mM) using MitoTracker staining. The graph shows the relative level of mitochondrial activity using ImageJ analysis. Statistical significance was calculated using Student’s t-test. **, p < 0.01. Error bars represent standard deviation. (B) Comparison of mitochondrial morphology in the muscle cells of caffeine-fed animals (10 mM) and that of the caffeine-free diet control group (0 mM) using MitoTracker staining. The graph indicates the percentage of animals with mitochondria classified as tubular, intermediate, fragmented, swollen, or aggregated. (C) The effect of caffeine intake on mitochondrial morphology was analyzed in the transgenic animal SJ4103 expressing a mitochondrial-targeted GFP under control of the muscle-specific myo-3 promoter. The graph indicates the percentage of animals with muscle mitochondria classified as indicated. (D) Myofilament abnormality owing to caffeine intake was visualized using the MYO-3::GFP transgene. Representative fluorescent images in the caffeine-free diet control group (0 mM) showed normal filament organization. MYO-3::GFP abnormalities (aggregations) were observed in the caffeine-fed animals (10 mM). The graph indicates the percentage of animals classified as having normal muscle or damaged muscle (aggregations).


