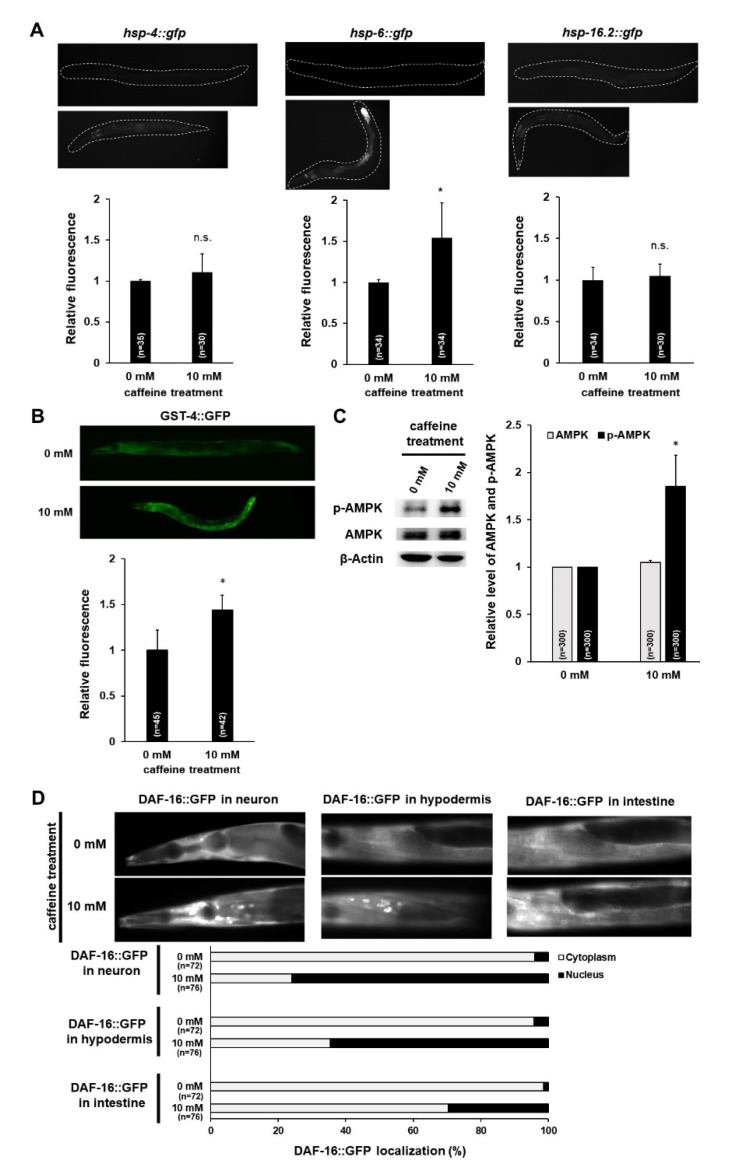
Figure 3.
Caffeine intake activates AMPK and DAF-16 by inducing the mitochondrial stress response in Caenorhabditis elegans. (A,B) HSP-4::GFP, HSP-6::GFP, HSP-16.2::GFP, and GST-4::GFP transgenic animals synchronized at the L4-stage were fed either 0 or 10 mM of caffeine for 24 h at 20 °C, and respective fusion proteins were observed under fluorescence microscopy and quantified using ImageJ analysis. Statistical significance was calculated using Student’s t-test. *, p < 0.05. n.s., p > 0.05. Error bars represent standard deviation (SD). (C) Western blot analysis of phospho-AMPK protein levels in animals fed the caffeine-free diet (0 mM) or caffeine diet (10 mM). AMPK and phospho-AMPK band intensities were normalized against those of β-Actin in the same lane. Then, the normalized AMPK and p-AMPK band intensities were converted to a relative value compared to the normalized AMPK and p-AMPK band intensities of 0 mM, as shown in the graph; values are mean ± SD of three biological replicates of lysates from 300 animals. Statistical significance was calculated using Student’s t-test. * p < 0.05. (D) Images show DAF-16::GFP expression pattern in both caffeine-free diet animals and caffeine-fed animals in the respective tissues. The graph indicates the percentage of animals that show the distribution of subcellular localization of DAF-16 in the respective tissues.

