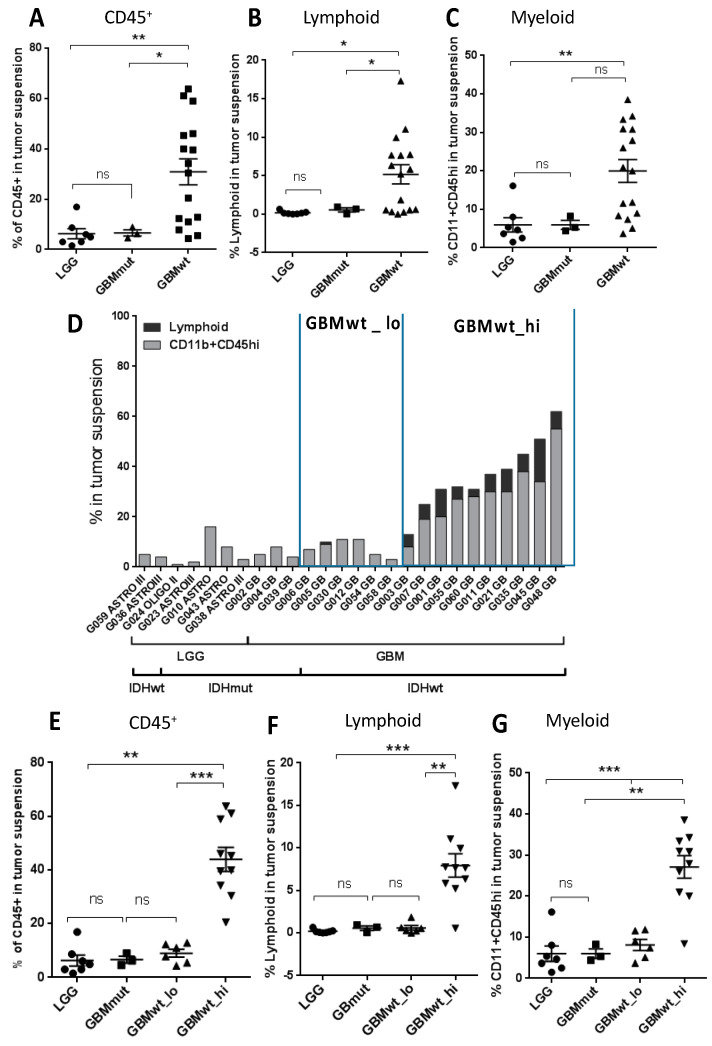
Figure 1.
Flow cytometry analysis of the immune infiltrate of gliomas. (A–C) Percentage of CD45+ (A), lymphoid (CD45+CD11b−SSClo) (B) and myeloid (CD45+CD11b+SSClo or SCChi) (C) cells on total tumor suspensions in lower-grade glioma (LGG) (circles) (n = 7) and glioblastoma (GBM)-expressing mutant IDH (GBMmut) (triangles in A and squares in B and C) (n = 3) and wild-type IDH (GBMwt) (squares in A and triangles in B and C) (n = 16). (D) Percentage of lymphoid or CD11b+CD45hi populations on total tumor suspension in individual samples. (E–G) Percentage of CD45+ cells (E), lymphoid (CD45+CD11b−SSClo) (F) and myeloid (CD45+CD11b+SSClo or SCChi) (G) cells on total tumor suspensions in the four groups of gliomas: LGG (circles) (n = 7), GBMmut (squares) (n = 3), GBMwt_lo (triangles) (n = 6), GBMwt_hi (inverted triangles) (n = 10). * p < 0.05, ** p < 0.01, *** p < 0.001, ns: not significant.

