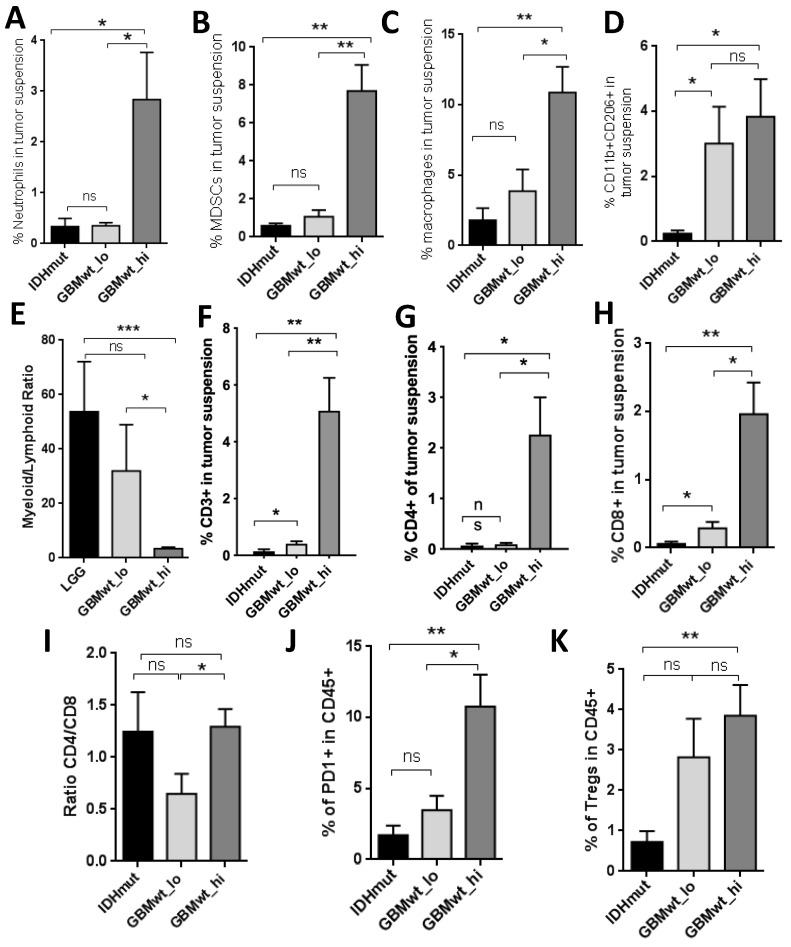
Figure 2.
Proportions of myeloid and T cell subsets in glioma samples. (A–C) Percentage of neutrophils (A), myeloid-derived suppressor cells (MDSCs) (B) and macrophages (C) on total tumor suspensions from IDHmut (IDHmut LGG and GBM) (n = 6), GBMwt_lo (n = 5), and GBMwt_hi (n = 6) gliomas. (D–E) Percentage of CD206+ myeloid cells (D) and myeloid to lymphoid ratio (E) on total tumor suspensions from IDHmut (n = 4), GBMwt_lo (n = 6), and GBMwt_hi (n = 10) gliomas. (F–I) Percentage of T cells (F), CD4+ T cells (G) and CD8+ T cells (H) and ratio of CD4+ to CD8+ T cells (I) on total tumor suspensions from IDHmut (n = 4), GBMwt_lo (n = 6), and GBMwt_hi (n = 10) gliomas. (J–K) Percentage of PD1+ T cells (J) and T regs (K) within the CD45+ tumor subset of IDHmut (n = 5), GBMwt_lo (n = 6), and GBMwt_hi (n = 7) gliomas. * p < 0.05, ** p < 0.01, *** p < 0.001, ns: not significant.

