Figure 3.
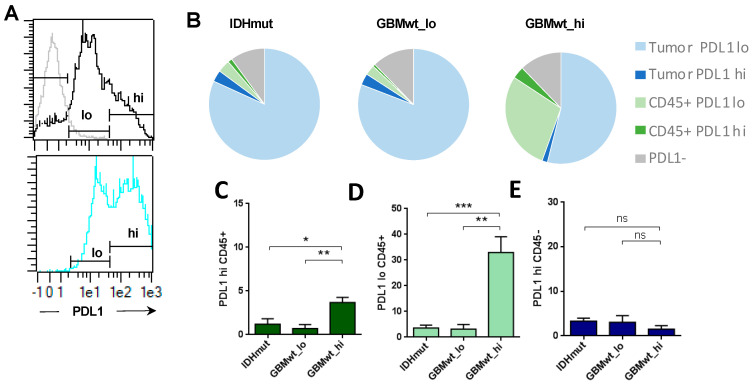
Programmed death ligand 1 (PD-L1) expression in gliomas. (A) The histograms show the isotype control labelling in grey line (negative) and low (lo) and high (hi) levels of expression of PD-L1 in the total tumor suspension (top, black line), or in the CD45+ subset (bottom, blue line) of a representative GBMwt_hi tumor. (B) The tart diagrams show the percentage of PD-L1lo and PD-L1hi tumor cells (CD45−) and leukocytes (CD45+) on total tumor suspensions in each glioma subgroup: IDHmut (n = 6), GBMwt_lo (n = 4) GBMwt_hi (n = 5). (C–E) Percentage of PD-L1hiCD45+ (C), PD-L1loCD45+ (D) and PD-L1hiCD45− (E) in each glioma subgroup. * p < 0.05, ** p < 0.01, *** p < 0.001, ns: not significant.

