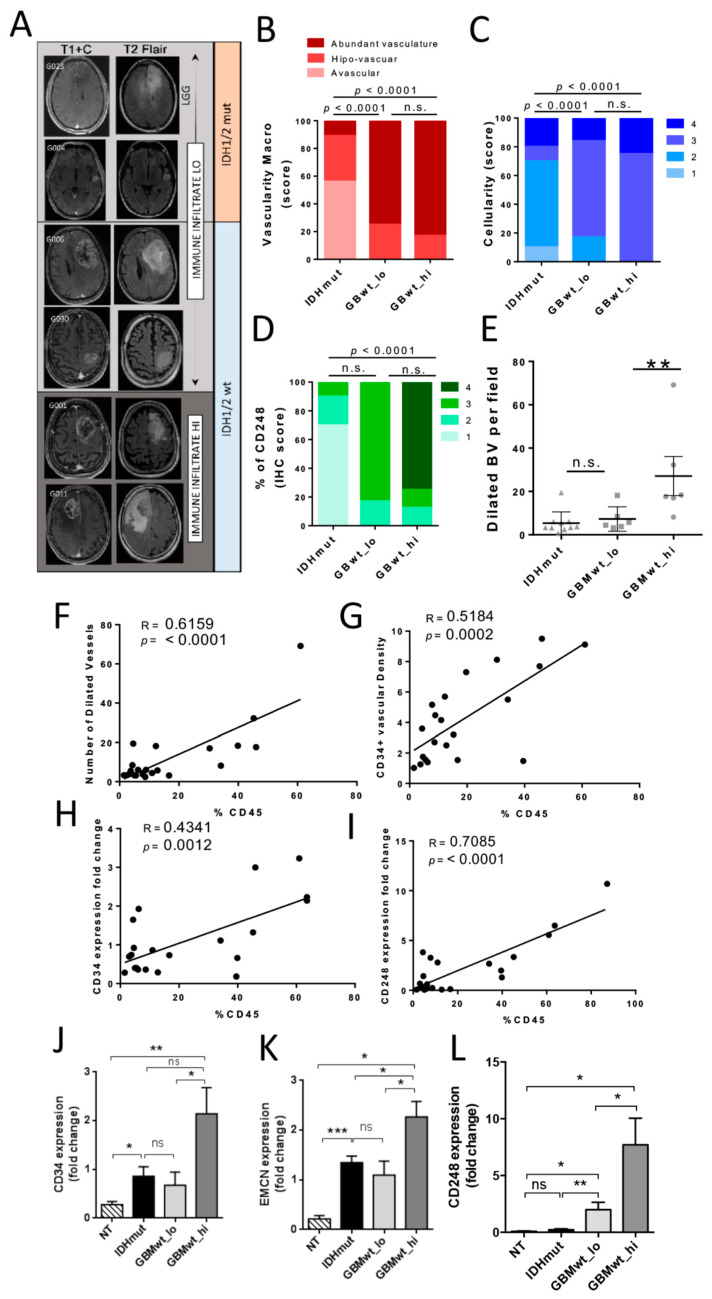
Figure 4.
Correlation between the immune infiltrate and the vascular alterations in gliomas. (A) Representative magnetic resonance imagings (MRIs) (T1 post contrast (T1+C) and T2 FLAIR) of gliomas with low (LO) or high (HI) immune infiltrate. (B) Quantification of the blood vasculature score (macroscopic evaluation of the tumor vascularization (blood vessel (BV) macro) during surgery) in IDHmut (n = 9), GBMwt_lo (n = 6) GBMwt_hi (n = 8) tumors. (C–E) Quantification of the cellularity (estimated in the Hematoxilin & Eosine stainings) (C), the CD248 score (D), and the number of dilated blood vessels (BV) (E) in IDHmut (triangles) (n = 9), GBMwt_lo (squares) (n = 6) GBMwt_hi (circles) (n = 8) tumors. (F–G) Correlation between the percentage of CD45+ cells and the number of dilated BVs (F) and the density of CD34 staining (G) in the tissue sections (circles represent each individual tumor) (n = 21). (H–I) Correlation between the percentage of CD45+ cells and levels of CD34 (H) and CD248 (I) transcription measured by qRT-PCR analysis (circles represent each individual tumor) (n = 21). (J–L) qRT-PCR analysis of CD34 (G), EMCN (H), and CD248 (I) expression in normal tissue (NT) (n = 6) and in the three different glioma subgroups: IDHmut (n = 9), GBMwt_lo (n = 6) and GBMwt_hi (n = 8). HPRT transcription was used for normalization. * p < 0.05, ** p < 0.01, *** p < 0.001, ns: not significant.

