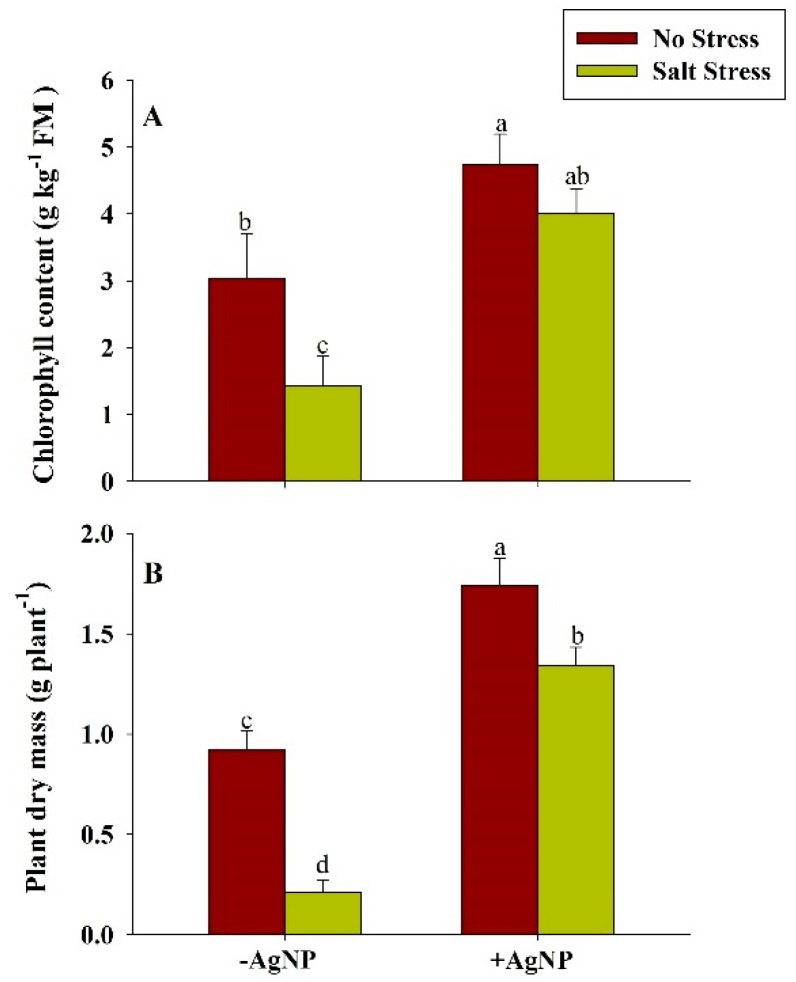
Figure 6.
Estimation of (A) Chlorophyll content and (B) plant dry mass content in wheat at 30 DAS. Plants were grown individually with 0 (control), 100 mM NaCl, 300 ppm AgNPs and NaCl combined with AgNPs. Data are presented as treatments mean ± SE (n = 3). Data followed by the same letter are not significantly different by LSD test at (p ˂ 0.05).

