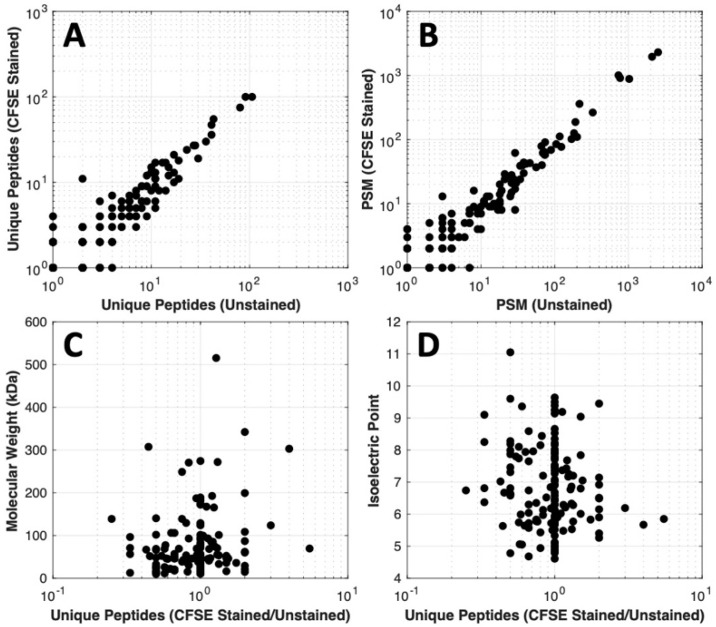
Figure 4.
Mass spectrometry data comparison of CFSE stained and unstained samples. Proteins were in-gel trypsin digested and analyzed by tandem mass spectrometry. Scatter diagrams. (A) The number of unique peptides detected per protein from stained vs. unstained samples; (B) Ratio of unique peptides in the CFSE stained over unstained vs. molecular weight; (C) Number of peptide spectra matches per protein in the stained vs. unstained samples; (D) Ratio of unique peptides in the CFSE stained over unstained vs. isoelectric point.

