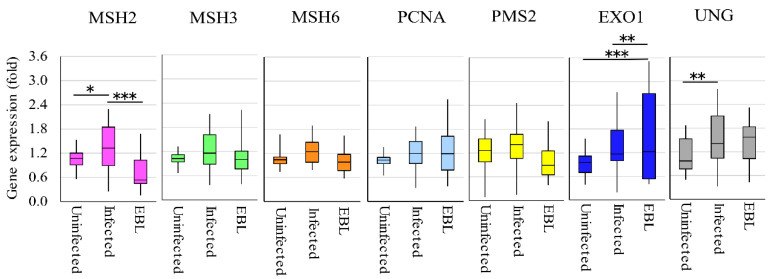
Figure 6.
The expression levels of MMR genes in different cattle groups. DNAs were extracted from bloods of cattle containing 20 uninfected cattle, 25 BLV-infected without onset, and 20 EBL with lymphoma to measure the expression of MMR gene using qRT-PCR. The vertical axis indicates the relative expression of each MMR gene when the expression level of each gene in uninfected cattle was set to 1. The upper bar indicates maximum and lower bar shows the minimum values. The black line at the center of the graph indicates the median value. The p value was calculated by Tukey’s test after the analysis of variance. Significant differences are indicated by asterisks (* p < 0.05, ** p < 0.01 and *** p < 0.001).

