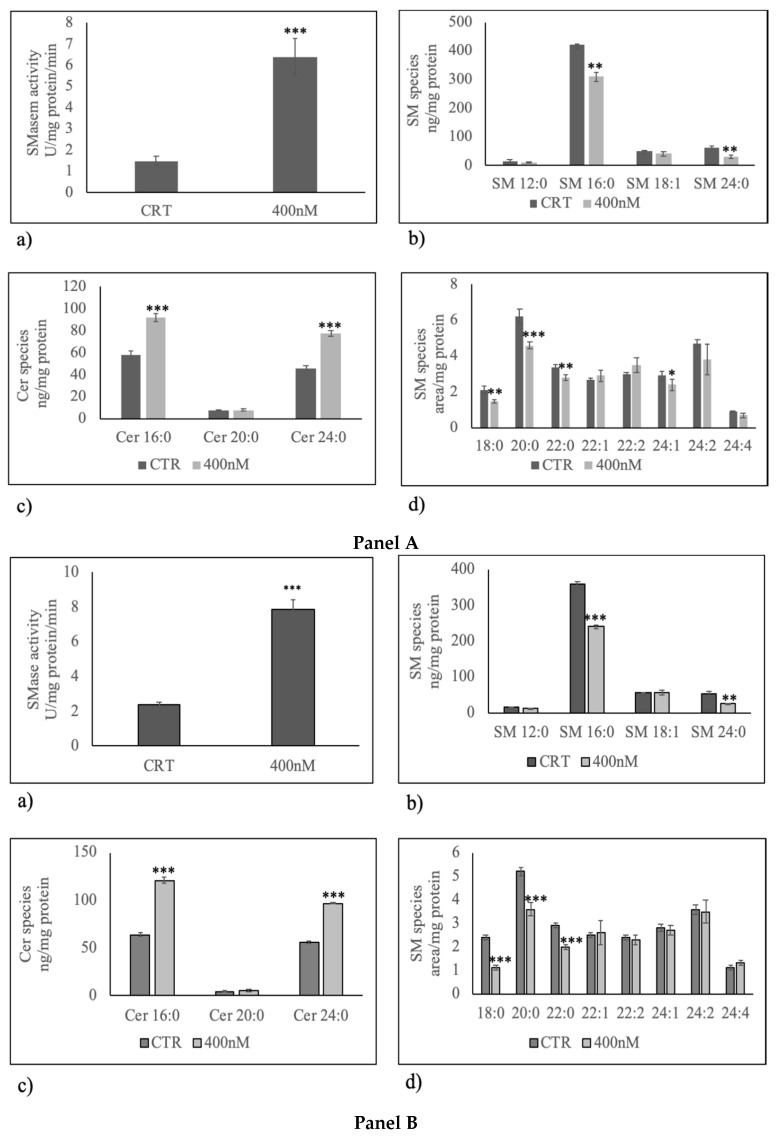
Figure 4.
Effect of 400 nM 1α,25(OH)2D3 on sphingomyelin (SM) breakdown. Panel A, U251 cells; Panel B, LN18 cells. (a) Sphingomyelinase activity. The enzyme activity was evaluated by using the Amplex Red Sphingomyelinase assay kit, as reported in the “Materials and Methods” section. Data were expressed as mU/mg protein/min; (b) SM species studied by using 16:0 SM, 18:1 SM, and 24:0 SM external calibrators. Data are expressed as nmol/mg protein; (c) ceramide species studied by using Cer 16:0, Cer 20:0, Cer 24:0 external calibrators. Data are expressed as nmol/mg protein; (d) SM species evaluating the areas of all the peaks identified on the basis of their molecular weight. Data are expressed as area/mg protein. Data are expressed as the mean ± S.D. of 3 independent experiments performed in duplicate. ∗ p < 0.05, ∗∗ p < 0.01, ∗∗∗ p < 0.001.

