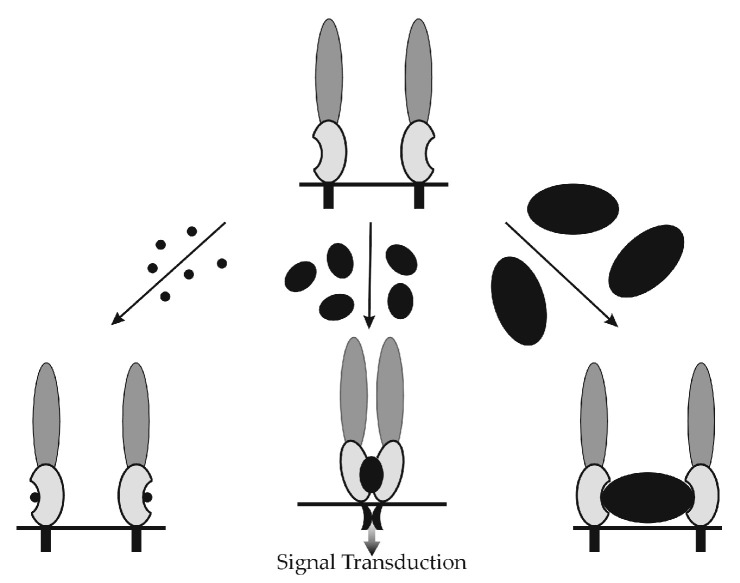
Figure 8.
A model for HA-size dependent activation of HARE and ERK signaling. The scheme [80] leads to HARE dimer formation and activation of signal transduction (bottom middle). Symbols denote; membrane (horizontal black lines), CD (black rectangles), HA binding Link module (light gray indented ovals), ectodomain (N-terminal to Link module; long dark gray ovals) and HA size ranges of <40 kDa (small black dots), 40–400 kDa (small black ovals) and >400 kDa (large black ovals).

