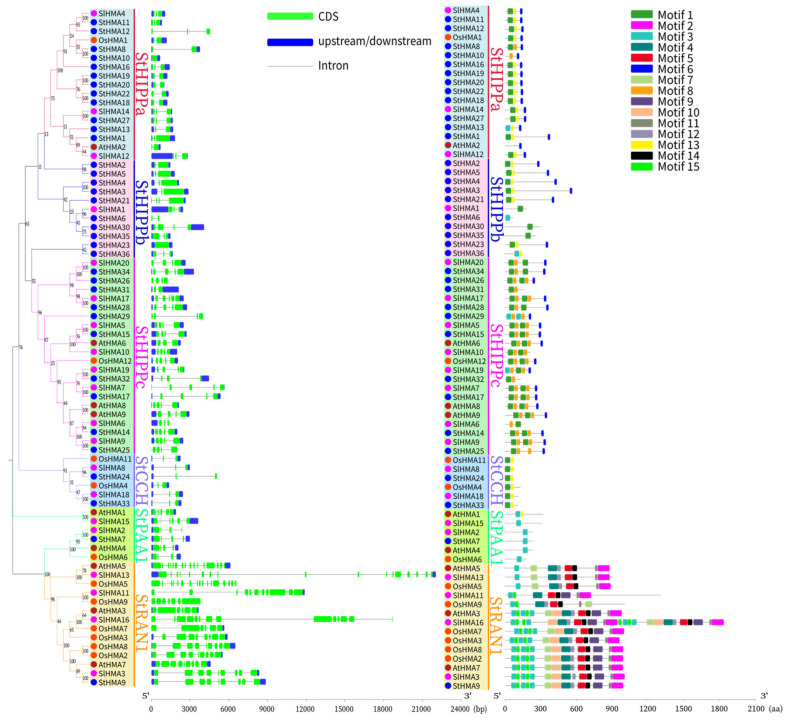
Figure 6.
Exon-intron structure, phylogenetic relationships, and protein domain analysis of StHMAs genes in potato. Phylogenetic relationships and exon-intron structure of StHMA genes. Green lines indicate introns. Blue boxes represent upstream/downstream-untranslated regions. The scale bar at the bottom estimates the lengths of the exons, introns, and untranslated regions. Phylogenetic relationships and motif structures of HMA proteins between Solanum tuberosum, Arabidopsis thaliana, Oryza sativa and Solanum lycopersicum. The maximum likelihood tree was generated with MEGA X using the NJ method. StRAN1, StPAA1, StCCH, StHIPPa, StHIPPb, and StHIPPc are marked with different colors. Motif analysis was performed using the MEME program. Boxes of different colors represent the various motifs. Their location in each sequence is marked. Motif sequence logo is shown in Table S5. The scale bar at the bottom indicates the lengths of the HMA protein sequences.

