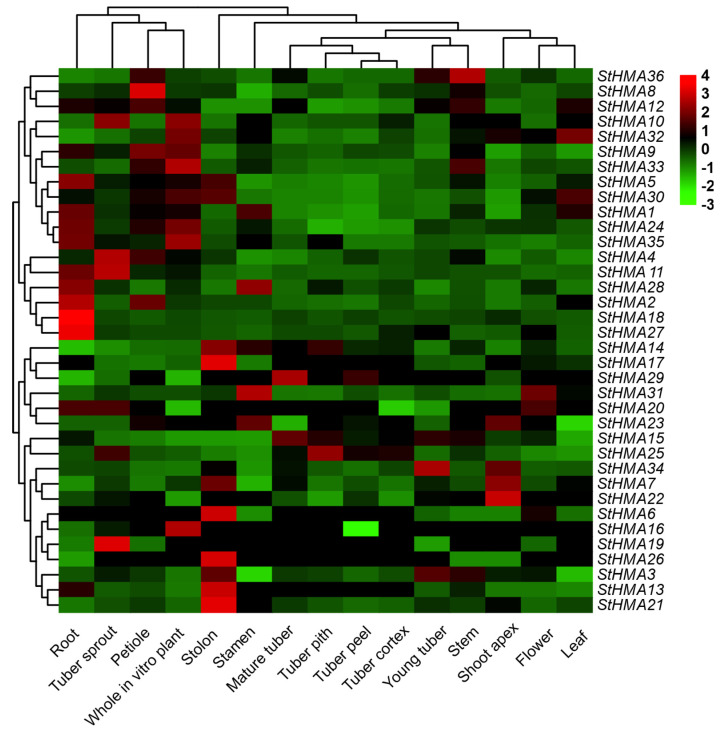
Figure 7.
Tissue-specific expression profiles of StHMA genes in different Solanum tuberosum organs. The transcription levels of StHMA genes in different tissues. Heatmaps were generated using the TBtools (Toolbox for biologists V.1.046) software from the normalized value by row for the signatures in transcripts per million (TPM), and gradient color from green to red was transcript levels of each StHMA gene. StHMA family were acquired from the gene expression profiles database (ArrayExpress, https://www.ebi.ac.uk/arrayexpress) (accession number: E-MTAB-552), are listed in Table S7.

