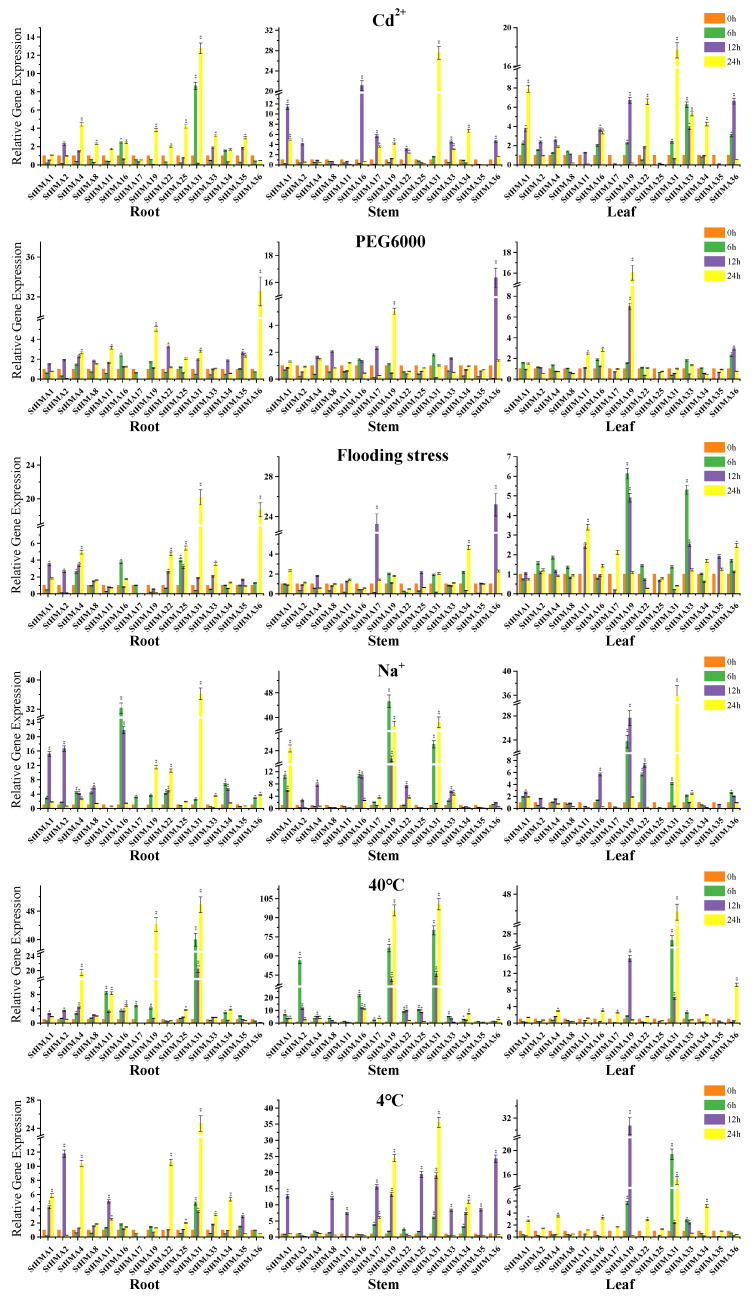
Figure 9.
Expression profiles of 15 selected StHMAs in response to 40 °C, 4 °C, 30% PEG6000 (mass ratio), 25% NaCl (mass ratio), and 1g/L CdCl2 stresses in 2-months old potato seedlings after treatment for 6, 12, and 24 h. Data represent means (±SD) of three biological replicates. Vertical bars indicate standard deviations. Asterisks indicate corresponding genes significantly upregulated or downregulated between the treatment and control (n = 15, * p < 0.05; ** p < 0.01; Student’s t-test).

