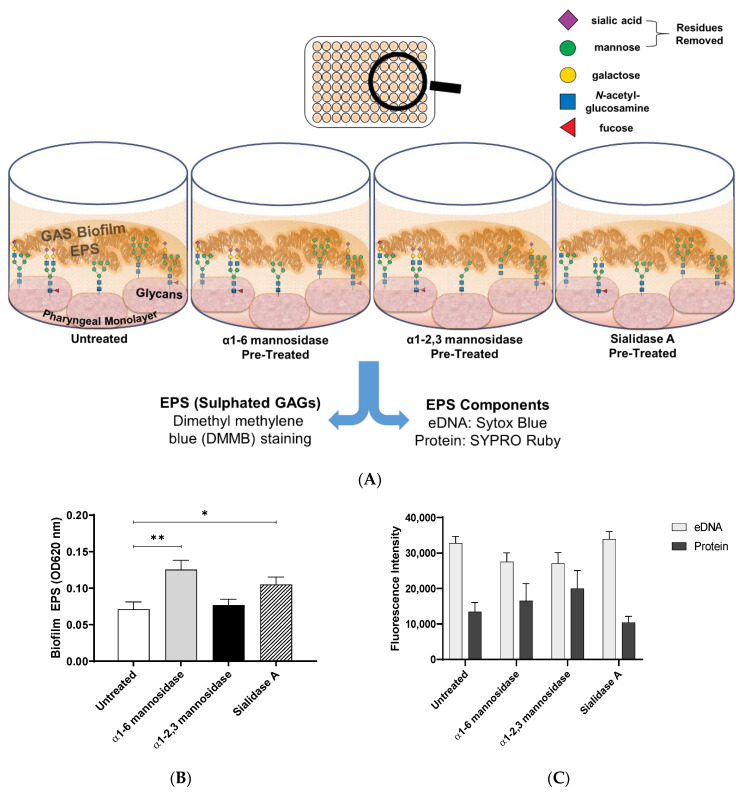
Figure 5.
Biofilm EPS increases significantly for biofilms formed on α1-6 mannosidase and Sialidase A pre-treated pharyngeal cell surfaces. (A) Assay schematic for the assessment of biofilm EPS resulting from biofilm formed on each of the exoglycosidase (α1-6 mannosidase, α1-2,3 mannosidase, and Sialidase A) pre-treated pharyngeal monolayers vs. untreated. 72 h biofilms were assessed for (B) EPS via DMMB staining of sulphated GAGs and (C) EPS associated components (eDNA and protein) via fluorescent staining with Sytox Blue and FilmTracer SYPRO Ruby biofilm matrix stain, respectively. Data represents mean ± SEM, with statistical analysis performed using a one-way ANOVA with Tukey’s multiple comparisons test * (p ≤ 0.05) and ** (p ≤ 0.01); n = 3 biological replicates, with 3 technical replicates each.

