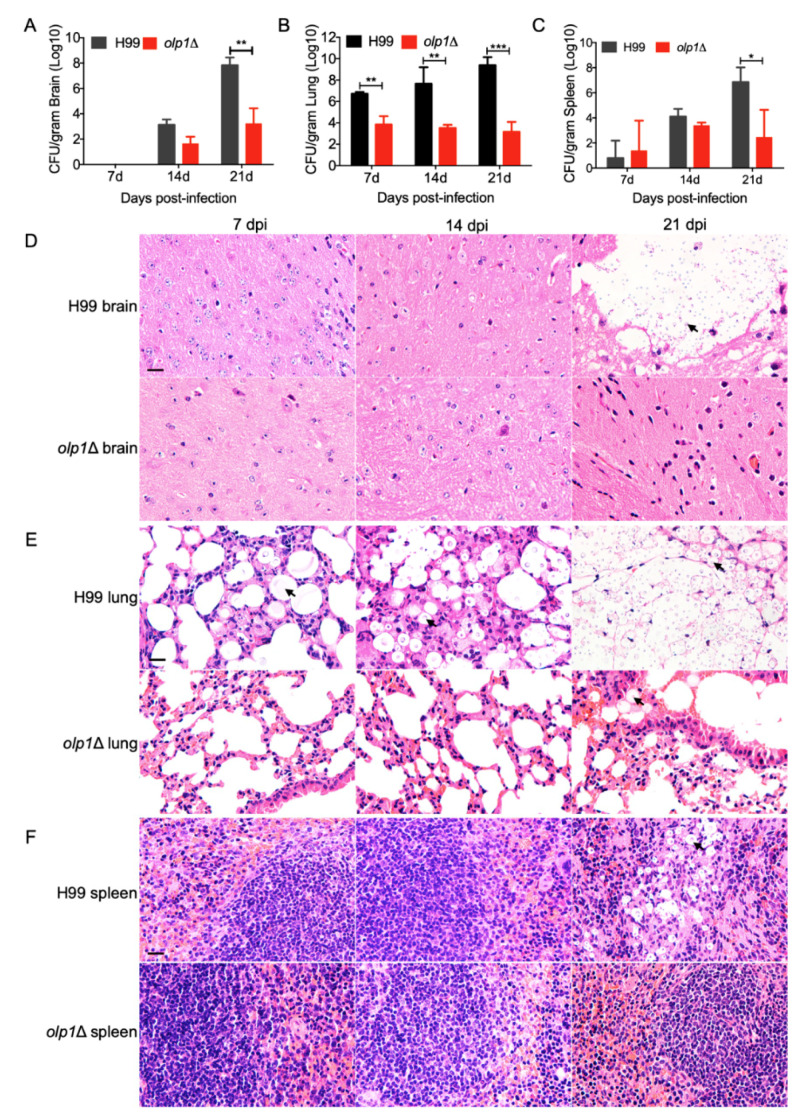
Figure 7.
Progression of olp1Δ mutants infection in organs of infected animals. (A) Brains from five mice infected with H99 and the olp1Δ mutants were isolated at 7, 14, and 21 days postinfection (DPI), respectively. CFU per gram of fresh organ was measured in brain homogenates. (B) Lungs from five mice infected with H99 and the olp1Δ mutants were isolated at 7, 14, and 21 DPI, respectively. (C) Spleens from five mice infected with H99 and the olp1Δ mutants were isolated at 7, 14, and 21 DPI, respectively. Each data point and the error bar indicate the mean and standard error of the mean for values from five animals. *, p ≤ 0.05, **, p ≤ 0.01, ***, p ≤ 0.001 (determined by Mann–Whitney test). (D–F) H&E-stained slides were prepared from cross-sections of infected brains (D), lungs (E), and spleens (F) at 7, 14, and 21 DPI, respectively, and visualized by light microscopy. Bar, 20 μm. Arrows indicate the cryptococcal cells.

