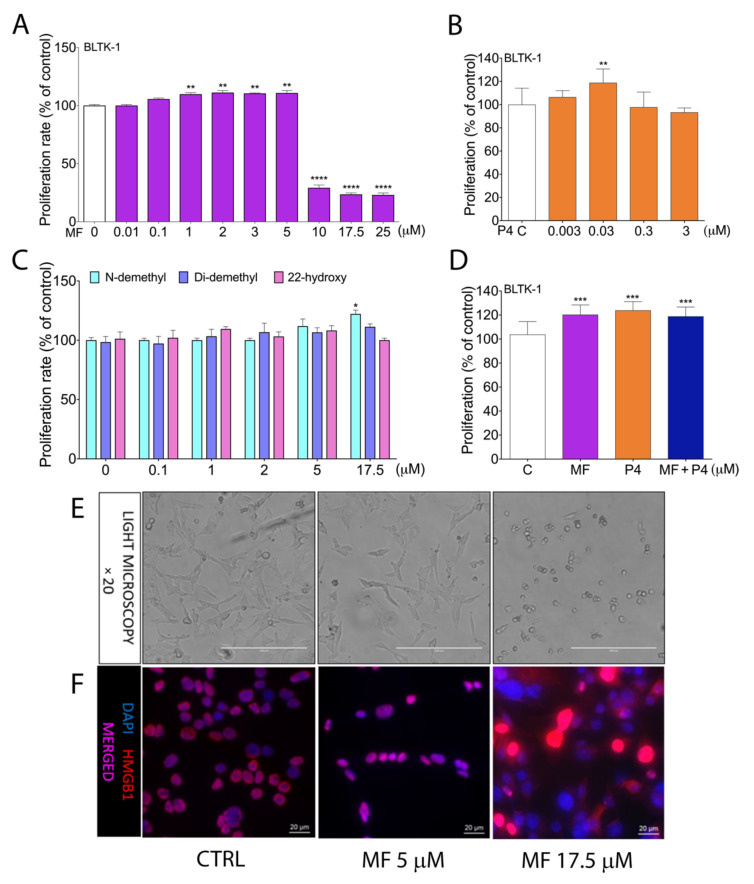
Figure 1.
Proliferation of BLTK-1 cells with MF, P4 or MF metabolite treatments. Effects of MF (A), P4 (B), the 22-hydroxy, N-demethyl and Di-demethyl MF metabolites (C) and MF with P4 (D) on BLTK-1 cells proliferation after 72 h treatments, measured by MTT and BrdU assay. Light microscopy images of BLTK-1 cells after 5 μM or 17.5 μM MF treatment (E). Immunolocalization of HMGB1 protein after 5 μM or 17.5 μM MF treatment of BLTK-1 cells (F). The proliferation level of the treated groups is presented as the percentage of control proliferation, considered as 100%. Asterisks indicate significant differences between the control and treated groups (*, p < 0.05; **, p < 0.01; ***, p < 0.001; ****, p < 0.0001.). Scale bar, 20 μm. Di-demethyl MF, (11β,17β)-11-(4-Aminophenyl)-17-hydroxy-17-(1-propyn-1-yl)-estra-4,9-dien-3-one; 22-hydroxy MF, (11β,17β)-11-[4-(Dimethylamino)phenyl]-17-hydroxy-17-(3-hydroxy-1-propyn-1-yl)-estra-4,9-dien-3-one; Inhα/Tag mice; transgenic mice expressing the SV40 Taq oncogene under the inhibin α promoter; MF, mifepristone; N-demethyl MF, (11β,17β)-17-Hydroxy-11-[4-(methylamino)phenyl]-17-(1-propyn-1-yl)-estra-4,9-dien-3-one; P4, progesterone.

