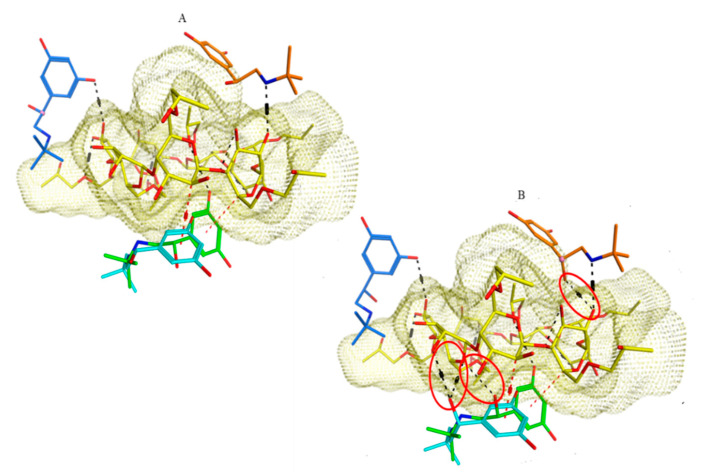
Figure 7.
Three-dimensional molecular visualization showing the predicted binding modes upon docking in HP-β-CD (yellow surface). Dotted red lines denote dipole interactions, while dotted black lines denote hydrogen bonding. (A) Interactions of four different S-TER conformations with the pocket (blue, cyan, green and orange structures), (B) docking of four different R-TER conformations anchored to the pocket by extra hydrogen bonding at the chiral center (oval red shapes).

