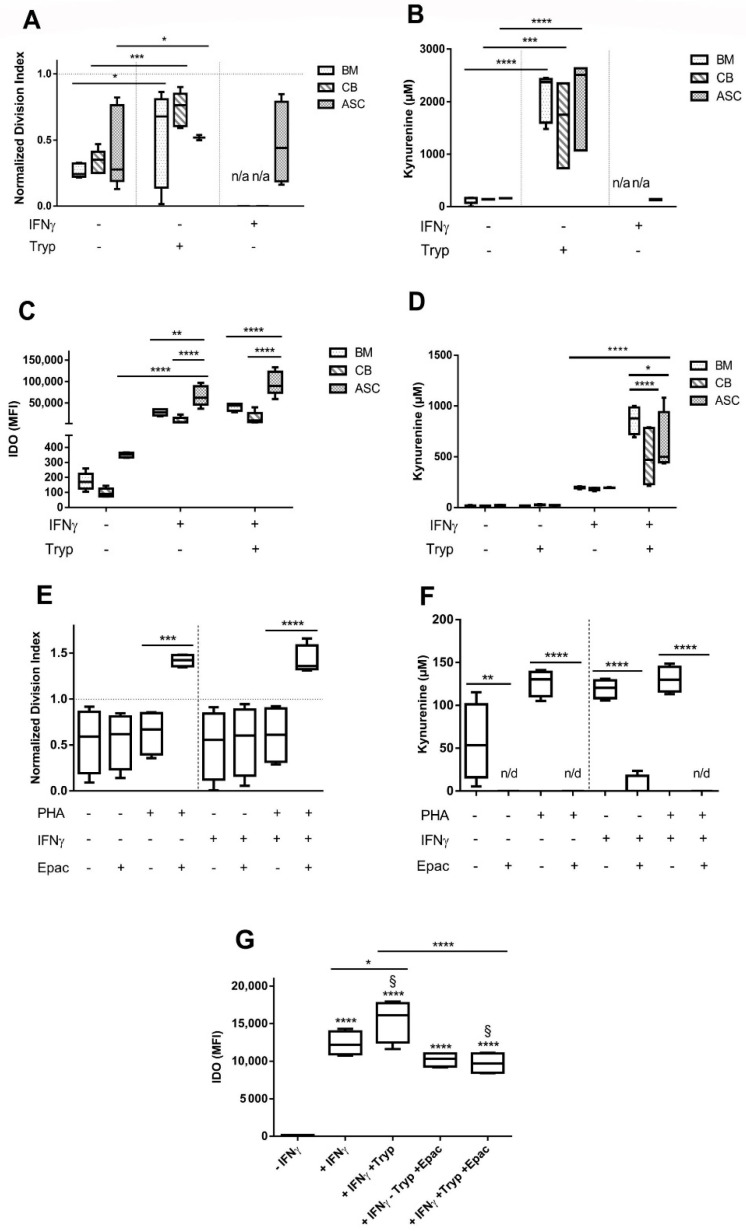
Figure 2.
IDO expression is induced by IFNγ stimulation and further increased with the addition of tryptophan, which in turn largely abrogates MSC inhibitory potential. (A) MSC:PBMC cocultures were set with BM, CB and ASC cells. Addition of IFNγ and Tryp were tested, n = 5 to 8. (B) Kynurenine coculture concentrations measured in presence of IFNγ and Tryp, n= 5 to 8. (C) IDO production is significantly increased when MSC are stimulated with IFNγ, n = 5. (D) Kynurenine concentrations measured in MSC monocultures after IFNγ addition are increased, n = 5. (E) ASC:PBMC cocultures were set with the addition of IDO inhibitor, Epacadostat, n = 4. (F) Kynurenine coculture concentrations completely abolished in presence of Epacadostat, n = 4. (G) IDO secretion in MSC monocultures is reduced when adding Epacadostat (p < 0.0001, 2-way ANOVA), n = 4. Box: interquartile range; whiskers: minimum to maximum; line: median. Dotted lines represent the normalisation referred to the positive control. Asterisks depicted at the top of the lines represent the significance of the individual value with respect to their own condition control (* p < 0.05, ** p < 0.01, *** p < 0.001, **** p < 0.0001). Symbol § represents the significance of the individual conditions with respect to their positive control (§: p < 0.0001, 2-way ANOVA). Lines with asterisks depict the significance between two conditions.

