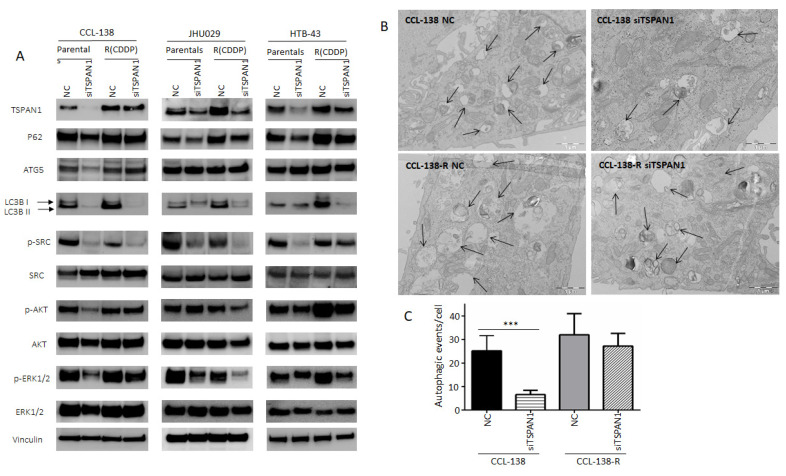
Figure 4.
Characterization of TSPAN1 downstream effectors. (A) Western blot analysis of proteins modulated by TSPAN1 depletion in HNSCC cells, including various key proteins related to autophagy and SRC/AKT/ERK signaling pathways. (B) Representative electronic microscopy images in TSPAN1-depleted cells vs. control cells (NC) in CCL-138 and CCL-138-R cells. TEM images revealed autophagosomes and autophagolysosomes, characteristic features of autophagic cells. (C) Quantification of autophagic vesicles from each experimental group. Note that autophagy vesicles decrease in CCL-138 cells upon TSPAN1 depletion. Unpaired two-tailed Student’s t-test, *** (p < 0.001).

