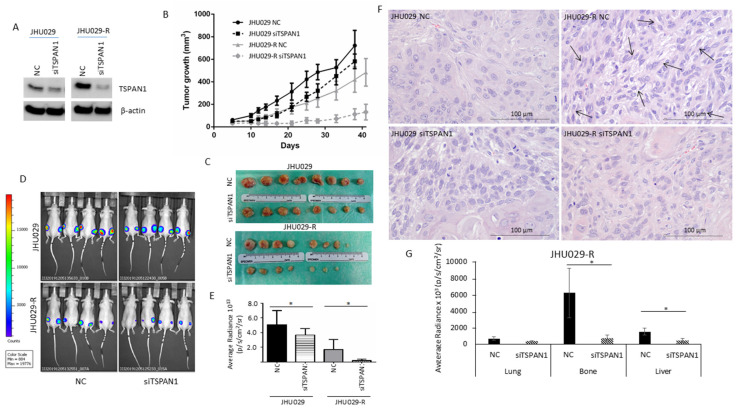
Figure 5.
Impact of TSPAN1 inhibition in vivo. (A) JHU029 and JHU029-R cells were transduced with siTSPAN1 and injected into immunosuppressed mice. TSPAN1 inhibition was monitored in cultured cells at day 2 after transfection. (B) Graph representing the growth of mice tumors originated from the indicated cell lines upon TSPAN1 inhibition vs. negative controls (NC). Data are expressed as mean ± SD. Significant differences were observed between JHU029 NC vs siTSPAN1 (days 10–28), and JHU029-R NC vs siTSPAN1 (days 12–41). Unpaired Student’s t-test. (C) Pictures of the tumors formed in the indicated group of mice. (D) Pictures of the mice tumors at the end point of the experiment. The luminescent signal was taken by the IVIS apparatus. (E) Quantification of the luminescent signals of tumors were acquired by Living Image software, and graphed. Unpaired two-tailed Student’s t-test, * (p < 0.05). (F) Representative images of H&E staining for the indicated mice tumors. Note the presence of a fusocellular pattern (arows) in the resistant cells but not in parental cells. The fusocellular pattern, indicative of EMT activation, was reverted in the TSPAN1-depleted tumor subgroup (JHU029-R-NC vs. JHU029-R-siTSPAN1). Scale bar: 100 µm (G) Quantification of micrometastases ex vivo based on luminescent signals acquired by Living Image software in the indicated organs from the JHU029-R mice tumors. Unpaired two-tailed Student’s t-test, * (p < 0.05).

