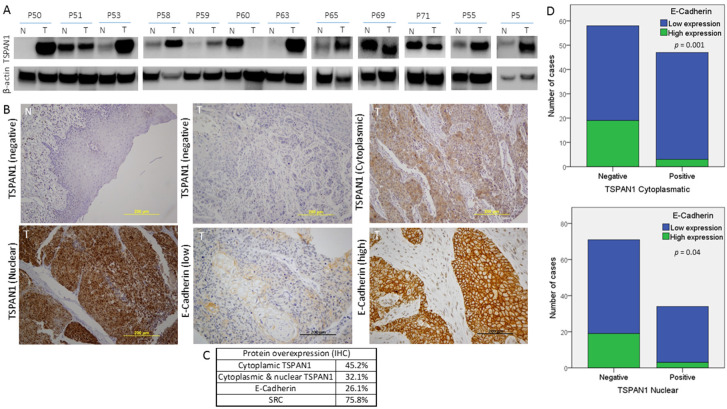
Figure 6.
Protein expression study of TSPAN1 in human biopsies from HNSCC patients. (A) Western blot of TSPAN1 protein in laryngeal and pharyngeal cancer biopsies comparing tumor (T) vs. normal tissue (N). (B) Representative images of IHC staining for TSPAN1 and E-Cadherin proteins. The expression of TSPAN1 was only observed in the tumor tissue, showing either a cytoplasmic or a cytoplasmic and nuclear pattern. (C) Table summarizes the percentage of patients with positive expression for the indicated proteins in the studied cohort of 106 HNSCC patients. (D) Correlation between E-Cadherin and TSPAN1 expression. The plots show the expression of cytoplasmic TSPAN1 (upper panel) and nuclear TSPAN1 (lower panel). χ2 test and Fisher’s exact test.

