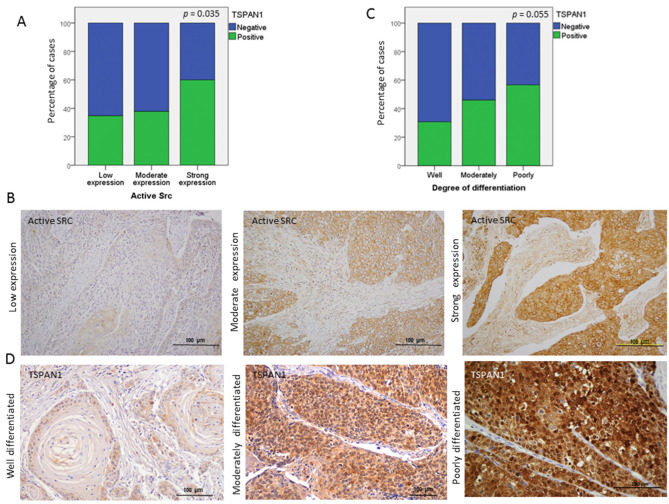
Figure 7.
Associations of TSPAN1 expression with active SRC and with the degree of tumor differentiation. (A) Direct correlation of TSPAN1 expression with active SRC. χ2 test and Fisher’s exact test, * (p < 0.05). (B) Representative IHC images for the different expression levels of active SRC (low, moderate and high). (C) TSPAN1 expression tends to correlate with the degree of tumor differentiation, showing higher TSPAN1 expression in patients with poorly differentiated tumors. (D) Representative IHC images to illustrate TSPAN1 expression along different degrees of tumor differentiation (well, moderately and poorly) as indicated.

