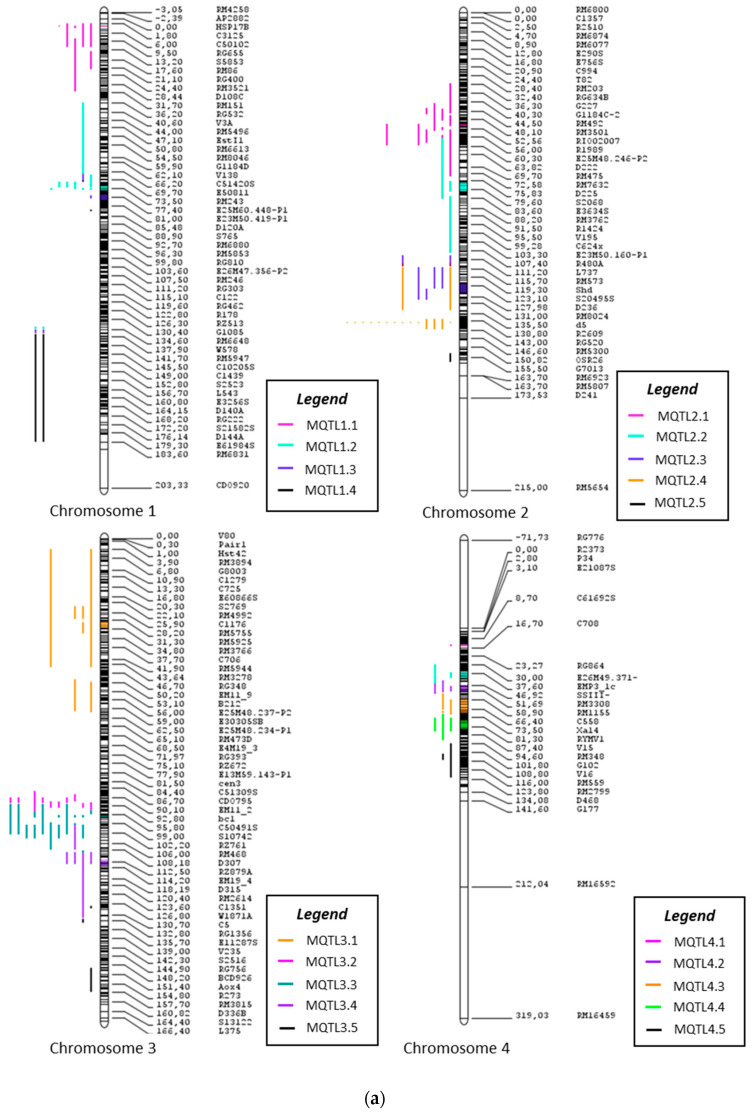
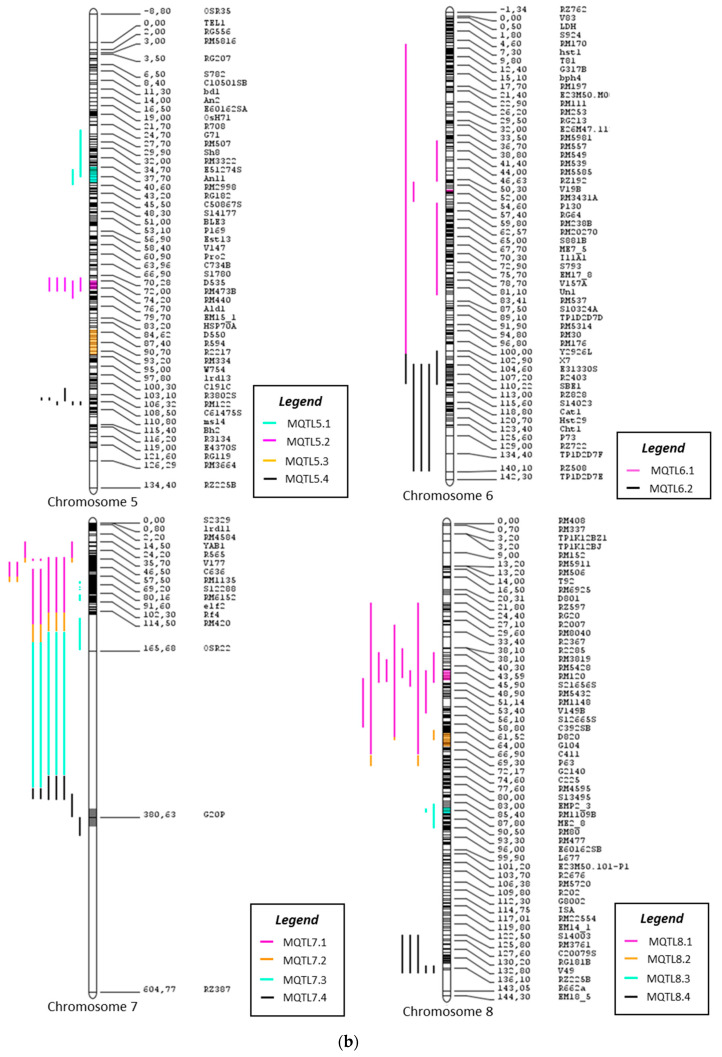
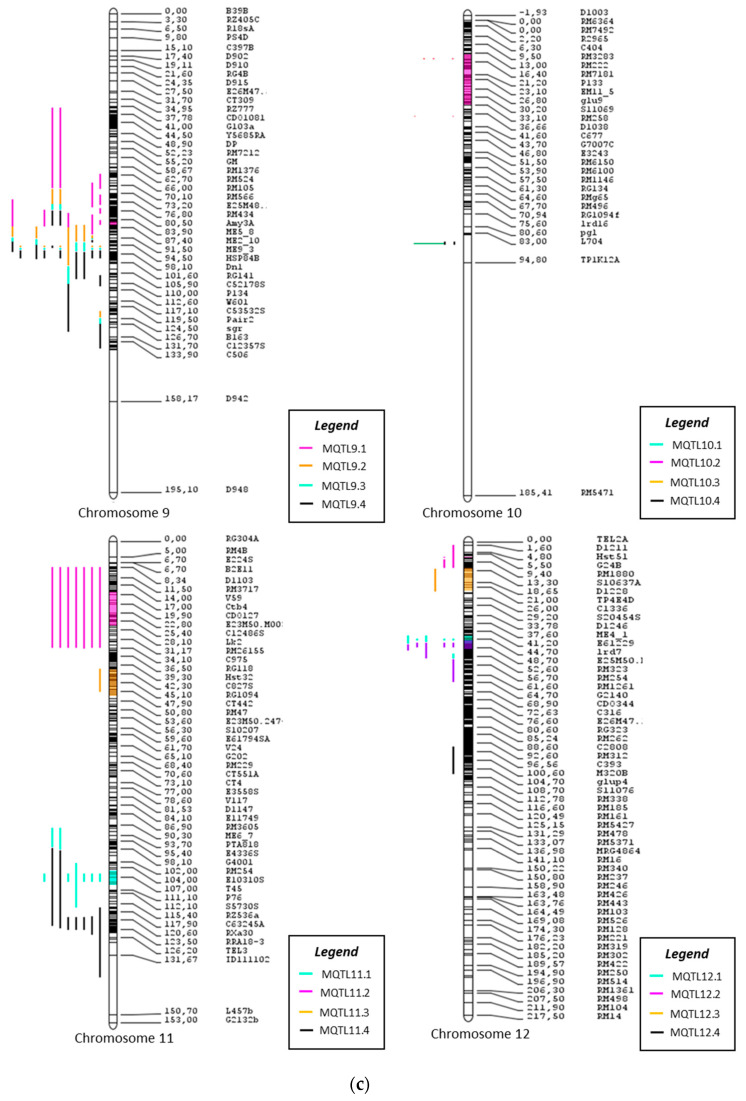
Figure 2.
The consensus map of the QTLs associated with RB, SHB and BLB resistance following meta-analysis, (a) chromosomes 1–4; (b) chromosomes 5–8; (c) chromosomes 9–12. The colored regions represent the meta-QTL regions with reduced confidence intervals. The QTL are colored according to their respective meta-QTL regions.


