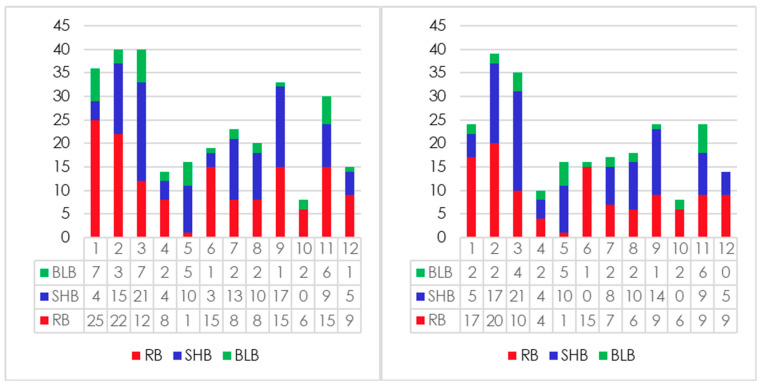
Figure 3.
Distribution of QTLs associated with resistance against sheath blight, rice blast and bacterial leaf blight across the chromosomes. The bar chart on the left depicts the number of QTLs assigned after meta-analysis, while the bar chart on the right depicts the number of QTLs after exclusion of QTLs with membership probability <60%.

