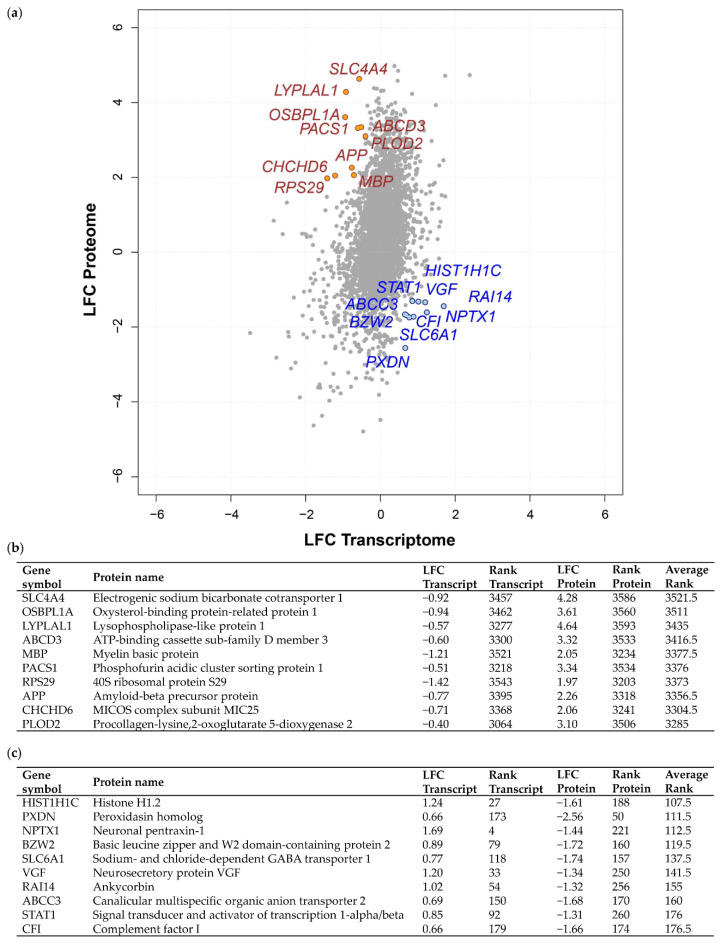
Figure 2.
Discordant transcriptome–proteome differential expression of grade III vs. grade I meningiomas. (a) Scatterplot displaying 3598 genes commonly identified in a transcriptomic microarray analysis including 13 non-recurrent grade I meningiomas and 28 malignant grade III meningiomas and a global proteomic analysis including eight grade I and six grade III meningiomas [12,19]. Log2 fold changes (LFC) at the transcript and protein level of overlapping genes are shown for grade III vs. grade I meningioma. The top 10 genes based on average rank value exhibiting either a negative transcript LFC and positive protein LFC (high average rank value) or a positive transcript LFC and negative protein LFC (low average rank value) are highlighted in yellow and blue, respectively. (b,c) Top 10 genes showing discordant differential expression with negative transcript LFC and positive protein LFC (b) or positive transcript LFC and negative protein LFC (c) in grade III vs. grade I meningiomas are presented with respective LFC, rank and average rank values. Table S3B provides details of all 3598 genes common to both analyses, transcript/protein LFC, their discordant rank value and average rank. Protein LFC values were ranked in ascending order (lowest LFC assigned rank of 1), transcript LFC values ranked in descending order and average rank calculated.

