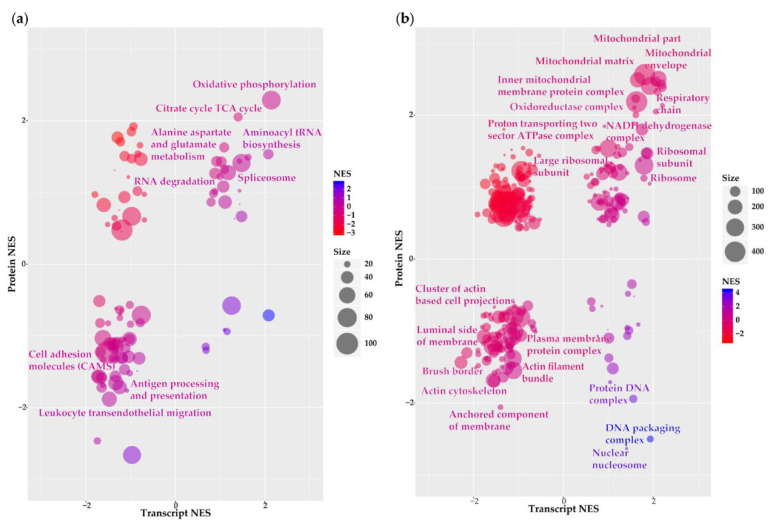
Figure 3.
Functional annotation of grade III vs. grade I meningioma transcriptome–proteome. (a) Kyoto Encyclopaedia of Genes and Genomes (KEGG) pathway analysis and (b) gene ontology (GO) analysis of cellular component terms presenting enriched pathways/cellular components overlapping between transcript and protein datasets. Bubble plots show normalised enrichment scores (NES) of pathways/cellular components derived from Gene Set Enrichment Analysis (GSEA) of genes ranked by transcript and protein LFCs. Size and colour of each bubble represent the number of differentially expressed genes enriched in the pathway and the combined transcript and protein NES, respectively. Highlighted are pathways/cellular components with false discovery rate (FDR) < 0.2 for both transcript and protein NES. Table S4 details KEGG pathway and GO cellular component output.

