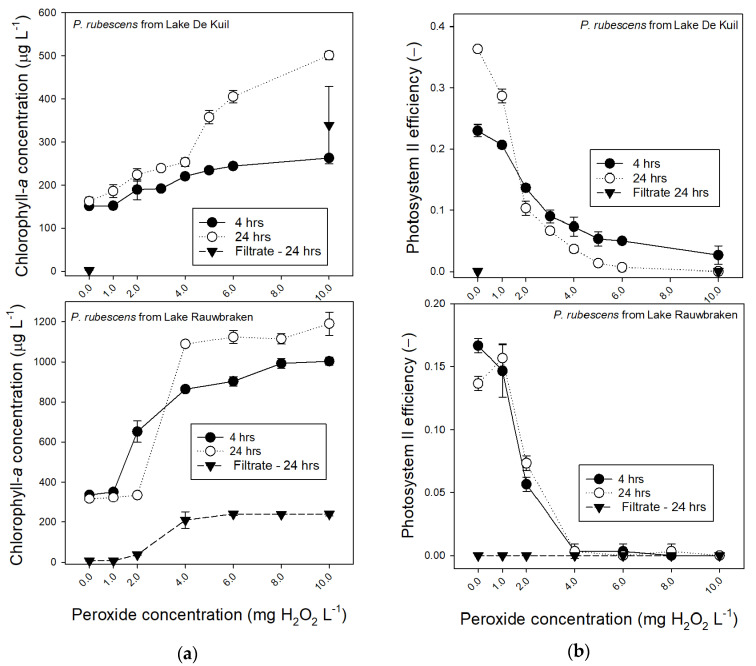
Figure 3.
(a) Chlorophyll-a concentrations (μg L−1) in 25 mL P. rubescens suspensions from Lake De Kuil (top panel) and Lake Rauwbraken (bottom panel) after 4 h exposure (filled circles) and 24 h exposure (open circles) to different concentrations hydrogen peroxide (0–10 mg L−1). Also included are the chlorophyll concentrations determined in 0.45 µm filtered samples after 24 h (triangles). Note that for Lake De Kuil these were only tested for the controls (0 mg L−1) and the 10 mg H2O2 L−1 treatment. Error bars indicate 1 SD (n = 3). (b) Photosystem II efficiencies of P. rubescens suspensions from Lake De Kuil (top panel) and Lake Rauwbraken (bottom panel) after 4 h exposure (filled circles) and 24 h exposure (open circles) to different concentrations hydrogen peroxide (0–10 mg L−1). Also included are the Photosystem II efficiencies determined in 0.45 µm filtered samples after 24 h (triangles). Error bars indicate 1 SD (n = 3).

