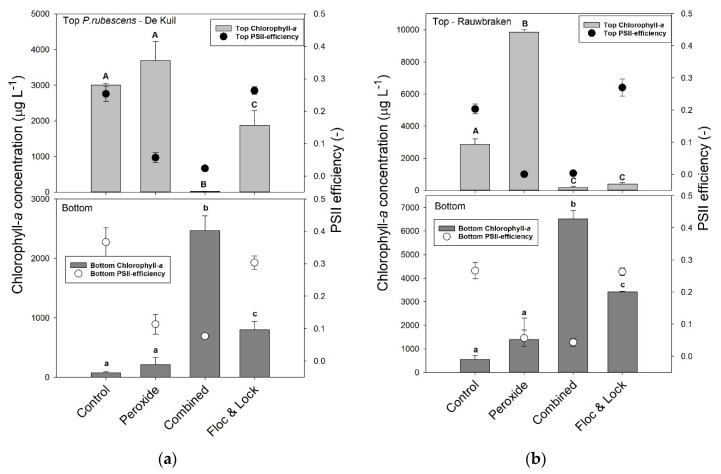
Figure 4.
Chlorophyll-a concentrations (μg L−1) in the top 2 mL (top light grey bars) and bottom 2 mL (lower dark grey bars) of 100 mL cyanobacteria suspension from (a) Lake De Kuil and (b) Lake Rauwbraken after 24 h exposure to hydrogen peroxide (5 mg L−1), peroxide + coagulant (2 mg Al L−1) and ballast (200 mg LMB L−1) (combined) or only coagulant (2 mg Al L−1) and LMB (Floc & Lock). Also included are the Photosystem II efficiencies (PSII) of the cyanobacteria collected at the water surface (filled circles) and at the bottom (open circles). Error bars indicate 1 SD (n = 3). Similar letters indicate homogeneous groups that are not different at the p < 0.05 level.

