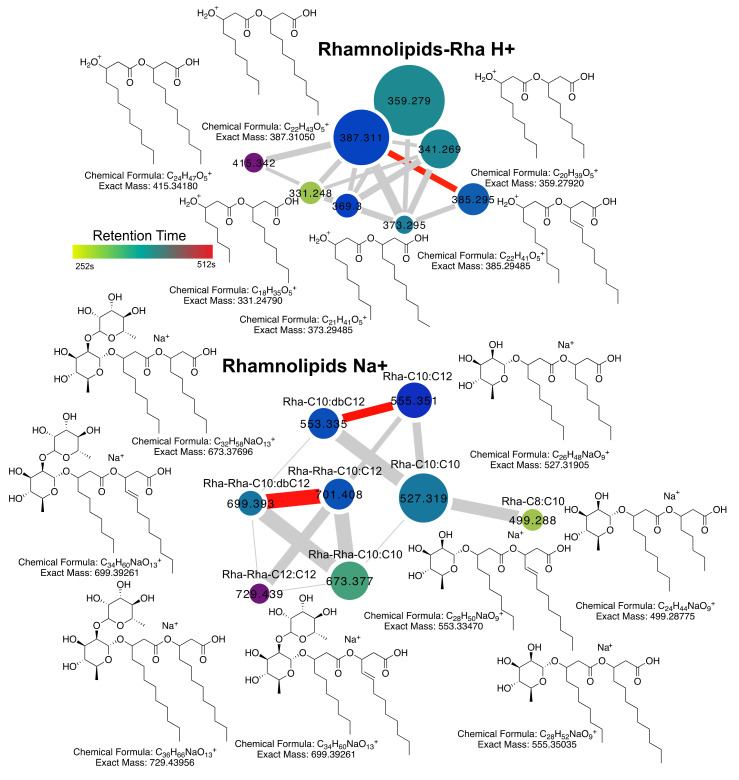
Figure 2.
Rhamnolipid diversity from P. aeruginosa clinical isolates. Molecular network and rhamnolipid structures for compounds identified in this study. The network nodes are colored by retention time according to the scale and sized by the number of spectra in the dataset. Edge width in the network is sized by the cosine score. Red edges represent those of a desaturation (Δ m/z = 2). The position of the FA double bond is unknown.

