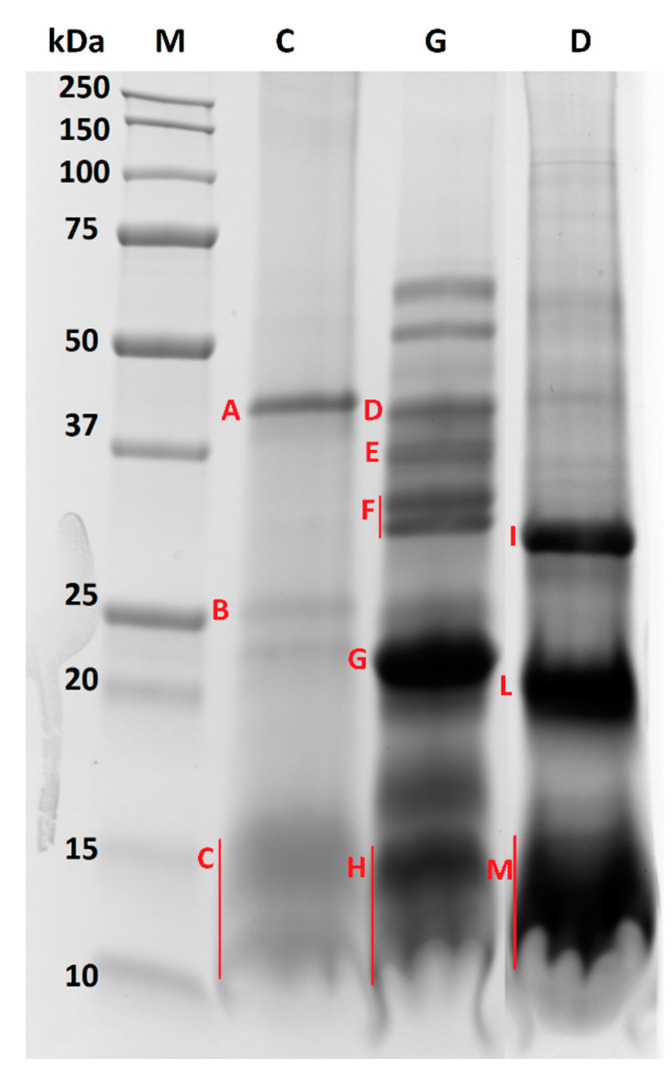
Figure 3.
Comparison of SDS-PAGE protein profiles referred to almond oleosomes submitted to chewing (lane C), gastric (lane G) and duodenal (lane D) digestion. Bands submitted to in-gel digestion for protein identification by LC-MS/MS analysis are marked with red capital letters from A to M for GI digested oleosome.

