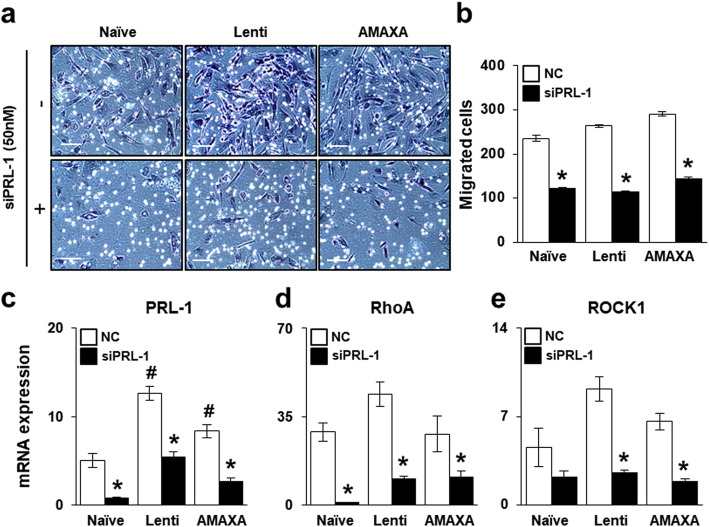
Fig. 3.
Effect of PRL-1-dependent migration ability through the Rho family. a, b Representative images and quantification of migrated naïve and PD-MSCsPRL-1 in a Transwell insert system treated or untreated with siRNA-PRL-1 (siPRL-1; 50 nM) after 24 h. Scale bars = 100 μm. qRT-PCR analysis of c PRL-1, d RhoA, and e ROCK1 expression in migrated naïve and PD-MSCsPRL-1 from the upper chamber to the lower chamber after treatment with or without siPRL-1. Data from each group are expressed as the mean ± SD. *p < 0.05 versus NC; #p < 0.05 versus naïve. NC, negative control; PRL-1, phosphatase of regenerating liver-1

