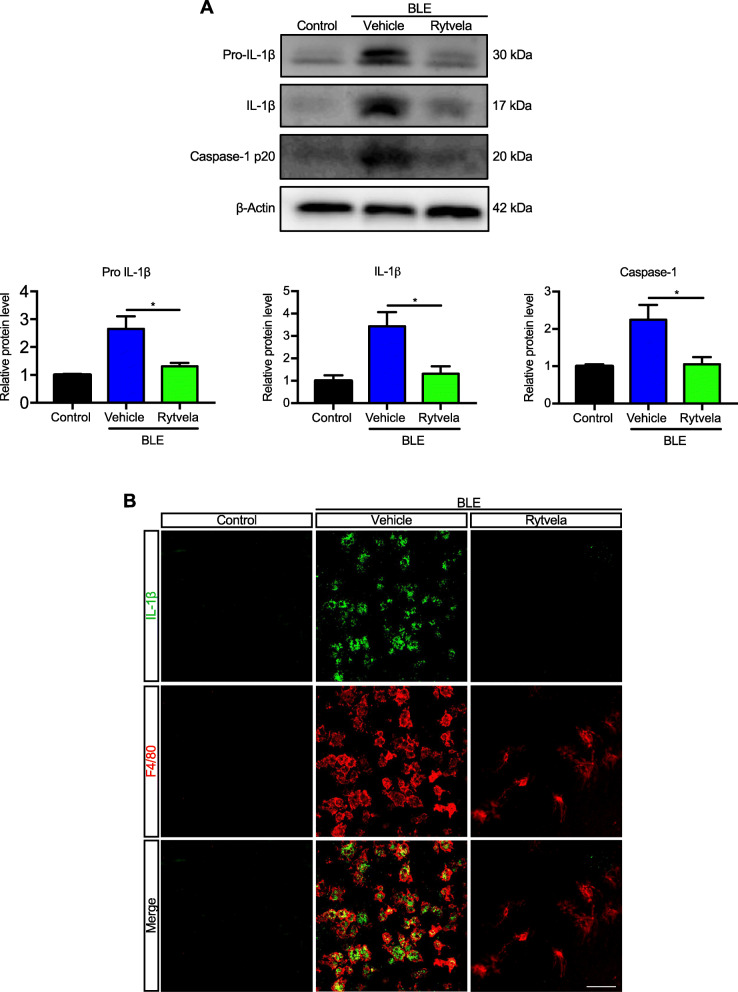
Fig. 2.
IL-1β production in blue-light-exposed mice. a Representative western blots (top panel) showing the expression of uncleaved pro-IL-1β, mature IL-1β, and cleaved caspase-1 p20 in retinal samples from blue light-exposed animals untreated (vehicle) or treated with rytvela and compared with non-illuminated animals (control). The bottom panel depicts compiled data in histogram format. Data are expressed as mean ± SEM and analyzed by independent t tests; n = 3–6 per group. **p < 0.01, *p < 0.05. b Representative images of retinal flat mounts showing co-localization of IL-1β (green) in mononuclear phagocytes F4/80+ cells (red) from blue light–exposed animals treated with vehicle or rytvela. Mice exposed to blue light and treated with rytvela displayed less IL-1β immunoreactivity; retinal samples from non-illuminated animals showed no positive reaction. n = 6 per group. Scale bar 50 μm

