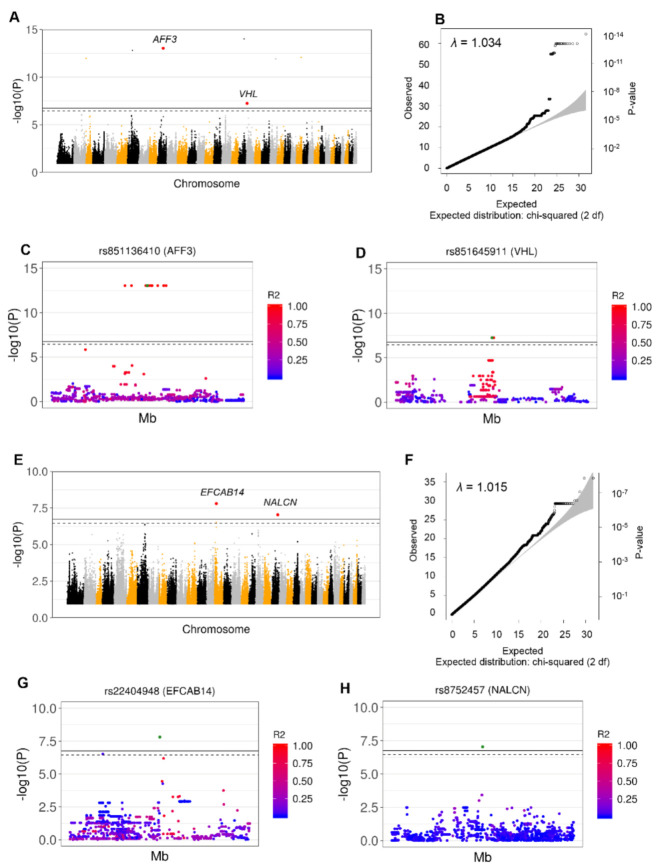
Figure 3.
Identification of GDV-Associated SNPs based on GWAS from WGS Data in Borzoi, Great Danes and GSDs. Significant SNPs were identified by GWAS across these breeds when including all samples (A to D) and excluding controls with GDV family history (E to H). (A) Significant signals detected adjusting for sex. Top SNPs for each peak are highlighted in red—chromosome in 10 (rs851136410; AFF3) and chromosome 20 (rs852404461; VHL). The colors indicate different chromosomes. (B) A Q-Q plot showing the correlation between expected and observed test statistic distribution. The inflation factor showed absence of population stratification (λ = 1.034). (C) Details of the rs851136410 (AFF3) region (±250,000 bp) showing the LD expressed as R2 between rs851136410 (green dot) and all other SNPs in the region. (D) Details of the rs851645911 (VHL) region (±250,000 bp) showing LD expressed as R2 between rs851645911 (green dot) and all other SNPs in the region. (E) Significant signals detected adjusting for sex. The top SNPs for each peak are highlighted in red – chromosome 15 (rs22404947; EFCAB14) and chromosome 22 (rs8752457; NALCN). The colors indicate different chromosomes. (F) A Q-Q plot showing the correlation between expected and observed test statistic distribution. The inflation factor showed absence of population stratification (λ = 1.015). (G) Details of the rs22404947 (EFCAB14) region (±250,000 bp) showing the LD expressed as R2 between rs22404947 (green dot) and all the other SNPs in the region. (H) Details of the rs8752457 (NALCN) region (±250,000 bp) showing the LD expressed as R2 between rs8752457 (green dot) and all the other SNPs in the region.

