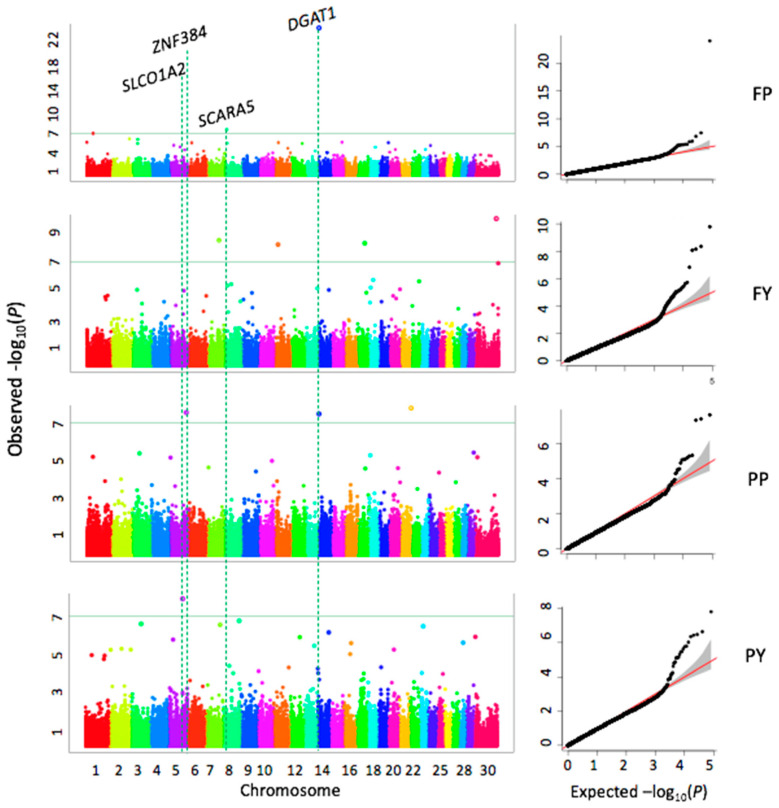
Figure 3.
Associations between 124,743 SNPs and milk traits. Milk traits include fat yield (FY), protein yield (PY), fat percentage (FP), protein percentage (PP). The association analyses were conducted by the FarmCPU R package. Manhattan plots display the negative logarithms of the observed p values for SNPs across 30 bovine chromosomes (left panel). The green line indicates the Bonferroni multiple test threshold at p = 4.0 × 10⁻⁷. The Quantile-Quantile (QQ) plots represent the negative logarithms of the expected p values (X-axis) and observed p-values (Y-axis) (right panel).

