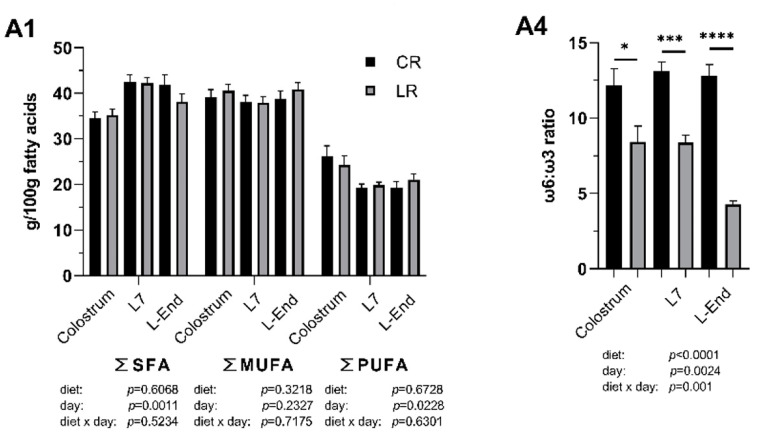
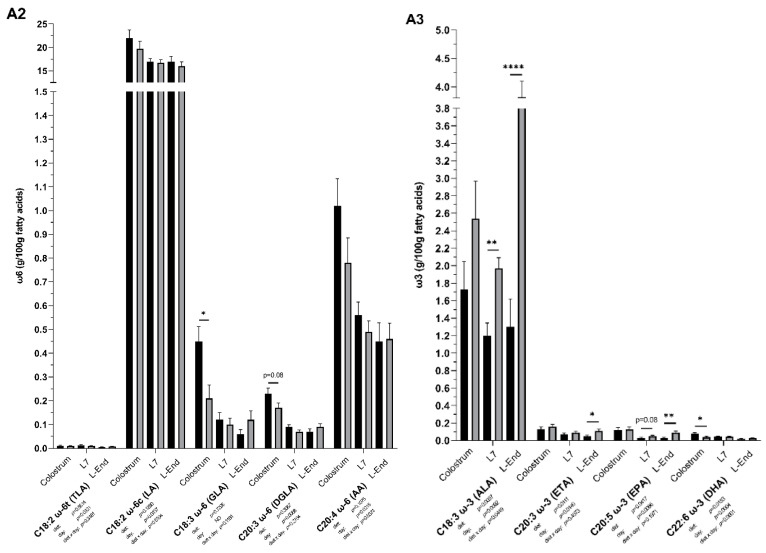
Figure 2.
Fatty acid (FA) profile (g/100 g FAs) of colostrum and milk collected on day 7 (L7) and the end of lactation (L-End) from sows fed diets included ω6:ω3 ratio = 13:1 during gestation, starting from day 28 (G28) and 10:1 during lactation (CR) or ω6:ω3 ratio = 4:1 from G28 until L-End (LR). A1: SFA, MUFA and PUFA concentrations. A2: Individual concentrations of ω6 PUFAs. A3: Individual concentrations of ω3 PUFAs. A4: ω6:ω3 ratio. SFA = Saturated FAs, MUFA = Monounsaturated FAs, PUFA = Polyunsaturated FAs, TLA = Linoleaidic acid, LA = Linoleic acid, GLA = γ-linolenic acid, DGLA = dihomo-γ-linolenic acid, AA = Arachidonic acid, ALA = α-linolenic acid, ETA = Eicosatrienoic acid, EPA = Eicosapentaenoic acid, DHA = Docosahexaenoic acid. Data are LSM ± SE; n = 5, 5 and 6 for CR group and 6, 7, 8 for LR group for colostrum, milk collected at L7 and L-End. * p < 0.05, ** p < 0.01, *** p < 0.001, **** p < 0.0001.


