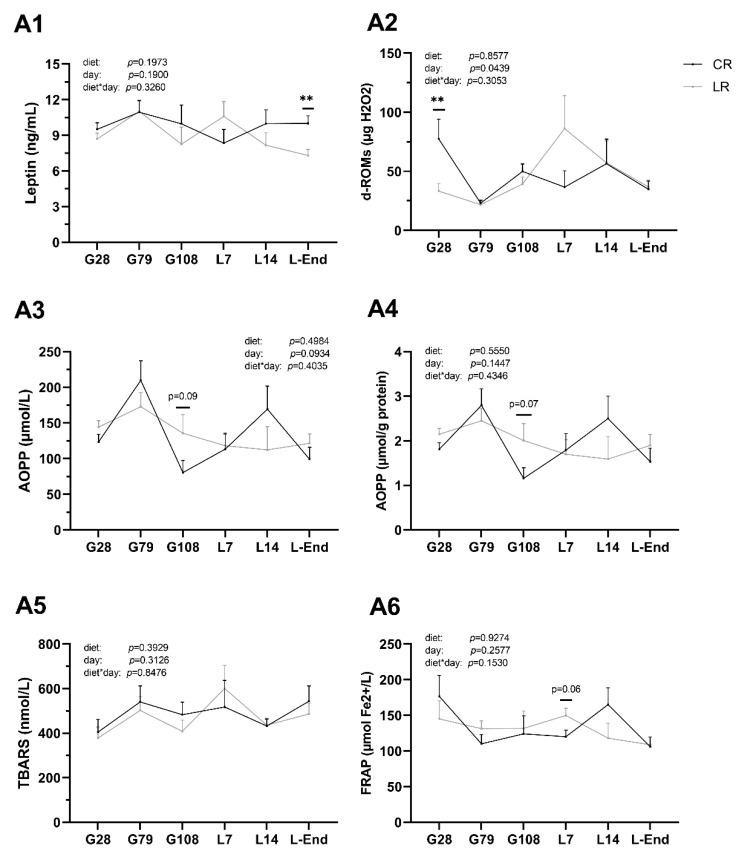
Figure 3.
Concentrations of leptin and oxidative stress indicators of sow plasma during gestation and lactation periods. A1: Leptin; A2: The derivatives of reactive oxygen metabolites (d-ROMs); A3, A4: Advanced oxidation products of proteins (AOPP); A5: Thiobarbituric acid reactive substances (TBARS); A6: Ferric reducing ability of plasma (FRAP). CR: sow diet with ω6:ω3 ratio = 13:1 during gestation, starting from day 28 (G28) and 10:1 during lactation; LR: sow diet with ω6:ω3 ratio = 4:1 from G28 until L-End. G: days of gestation, L: days of lactation. Data are LSM ± SE; n = 6–8 sows per group. ** p < 0.01.

