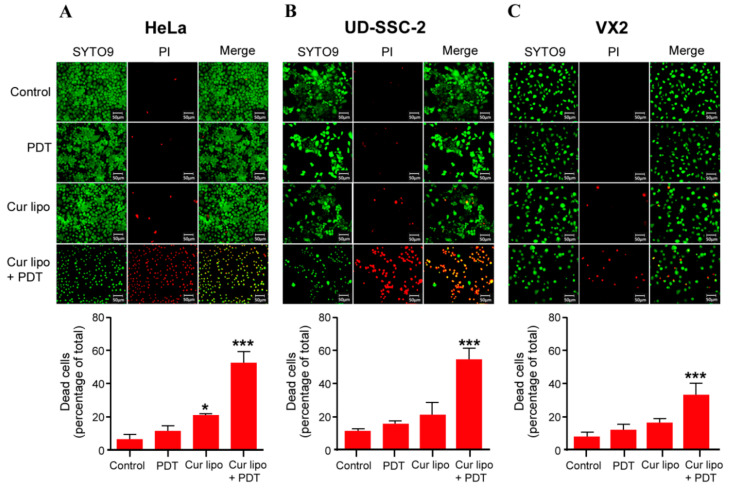
Figure 4.
Live/dead staining of HeLa (A), UD-SCC-2 (B), and VX2 (C) cells. Cells were treated with photodynamic therapy (PDT) only, with curcumin liposomes (Cur lipo) only, or with Cur lipo in combination with PDT. Untreated cells were used as a control. All cells were stained with SYTO9 (green fluorescence) showing uniform green fluorescent nuclei, while propidium iodide (PI) only labeled nonviable or dead cells (red fluorescence) representing late apoptotic or necrotic cells. Bar graphs represent the quantification of dead cells (percentage) in the different treatment groups. Treated cells were compared to untreated control cells. The values are shown as mean ± standard deviation, and statistical significances are indicated as *** p < 0.001, * p < 0.05.

