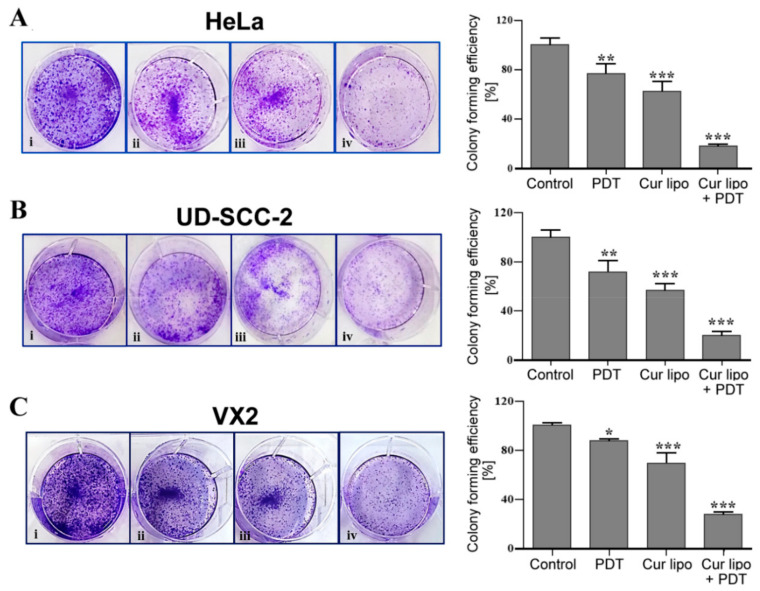
Figure 5.
Colony formation assay with HeLa, UD-SCC-2, and VX2 cells. HeLa (A), UD-SCC-2 (B), and VX2 (C) cells were exposed to photodynamic therapy (PDT) only (ii), curcumin liposomes (Cur lipo) only (iii), or Cur lipo in combination with PDT (iv). Untreated cells were used as a control (i). Cell colonies of HeLa (A), UD-SCC-2 (B), and VX2 (C) cells were stained with 0.1% crystal violet dye. Graphical data represent the level (percentage) of colony formation after exposure to the various treatment modalities compared to control values. Values are presented as the mean ± standard deviation, and statistical significances are indicated as *** p < 0.001, ** p < 0.01, * p < 0.05.

